Data Literacy for Beginners: How to Make Better Decisions
Every day, you encounter data in news reports, workplace documents, business dashboards, social media posts, surveys, and even personal budgeting apps. However, seeing numbers and charts is not the same as understanding what they mean or knowing whether they can be trusted.
Data literacy for beginners means developing the ability to read, understand, question, use, and communicate data confidently. You do not need advanced mathematics, programming skills, or professional experience as a data analyst to become data literate.
What matters is learning how to evaluate the reliability of a data source, interpret basic charts and statistics, recognise uncertainty and possible bias, and ask thoughtful questions before accepting a claim.

These practical skills can help you separate useful evidence from misleading information. They can also enable you to compare options more carefully, explain your conclusions clearly, and make more informed decisions at work, in business, and in everyday life.
What is data literacy?
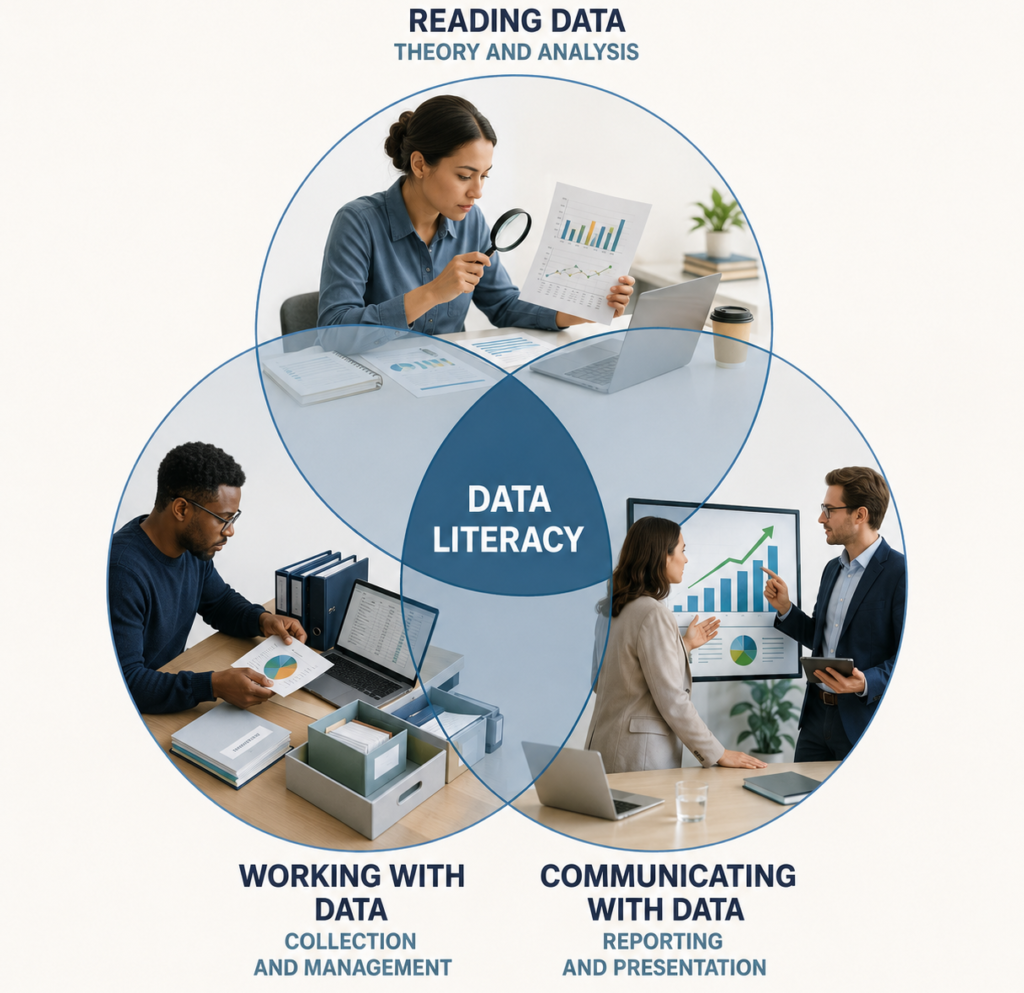
Data literacy is the ability to work with data confidently, critically, and responsibly. It involves reading, analyzing, and communicating data to make informed decisions without needing advanced mathematical or technical expertise.
- Core Competencies: Understanding data sources, interpreting basic charts and statistics, assessing data quality, and identifying missing context or bias.
- The Critical Mindset: A data-literate individual questions the evidence behind numbers by examining sample size, measurement metrics, collection methods, and timeframes.
- Data Literacy vs. Data Science: While a data scientist builds complex algorithms, predictive models, and machine learning systems, a data-literate professional focuses on practical application—interpreting dashboards, evaluating reports, and making evidence-based business decisions.
Why does data literacy matter?
Data literacy serves as an evidence-based filter that replaces subjective assumptions with verified insights across professional, entrepreneurial, and personal environments.
| Context | Core Applications | Operational Example |
| At Work | Dashboard tracking, campaign evaluation, resource allocation, cross-team reporting. | Checking whether a 20% surge in support tickets stems from business growth, a specific product release, or a changed reporting timeframe before hiring staff. |
| In Business | Unit economics, CAC vs. LTV, inventory optimization, conversion rate analysis. | Recognizing that high traffic yields low revenue without conversion optimizations, avoiding vanity metrics. |
| In Daily Life | Financial offer evaluation, media literacy, polling accuracy, subscription ROI. | Dissecting loan interest terms, nutritional claims, and energy consumption metrics to optimize personal spend. |
Data literacy for beginners does not mean replacing valuable domain expertise or professional intuition. Instead, it strengthens strategic judgment by grounding decisions in objective facts, reliable evidence, and a clearer understanding of what the data actually shows.
What skills do beginners need?
To build foundational data literacy for beginners, focus on mastering five core practical capabilities, spanning context interpretation, visualization, and fundamental statistics.
Understanding Data Representation
Before analyzing any metric, establish its scope and baseline context:
- Unit Verification: Determine if the metric measures absolute currency (₦, $), raw volume, percentages, or rates.
- Data Structure: Identify whether the value represents an exact total, an average, a sample estimate, or a point-in-time snapshot.
- Comparability: Ensure underlying metrics share identical baselines across compared timeframes or groups.
Example (The 10% Ambiguity): Stating “sales increased by 10%” lacks actionable meaning without a baseline. It could indicate a move from ₦100,000 to ₦110,000, a move from ₦1M to ₦1.1M, or a 10 percentage-point gain over a competitor.
Reading Visualizations & Spotting Distortions
Evaluate charts using a systematic verification sequence:
- Header & Source: Inspect the title, subtitle, data origin, and publication date.
- Axes & Scale: Confirm what each axis measures and verify if the vertical scale starts at zero.
- Data Alignment: Check legends and confirm if the visual pattern legitimately supports the headline claim.
- Chart Selection Guide: Use Bar charts for categorical comparisons, Line charts for temporal trends, Scatter plots for variable relationships, and Pie charts strictly for simple part-to-whole metrics (under 5 segments).
- Common Visual Red Flags: Truncated axes that exaggerate small changes, dual Y-axes with mismatched scales, 3D visual distortions, and charts presenting correlation as direct causation.
Interpreting Basic Statistics
| Statistical Term | Plain-English Meaning | Critical Audit Question |
| Mean | Arithmetic average | Are a few extreme outliers distorting the central value? |
| Median | Middle value in an ordered set | Does this better represent a typical transaction or individual? |
| Percentage | Proportion out of 100 | What is the base figure behind the percentage? |
| Rate | Metric normalized by population or time | Is the denominator calculated consistently over time? |
| Range | Spread between minimum and maximum | Do the extreme values expose operational risks or anomalies? |
| Sample | Representative subset of a population | Was the sample selected without selection bias? |
| Margin of Error | Plausible variance range of an estimate | Are two compared metrics statistically distinct or overlapping? |
Critical Statistical Concepts:
- Percentages vs. Percentage Points: A metric rising from 40% to 50% represents a 10 percentage point increase, but a 25% relative increase over the baseline ($10 / 40 = 0.25$).
- Mean vs. Median Sensitivity: In an income set of [₦80k, ₦90k, ₦100k, ₦110k, ₦1,000,000], the mean (₦276,000) is heavily skewed by one high earner. The median (₦100,000) reflects the typical baseline.
- Correlation vs. Causation: Parallel movement between two variables does not prove a cause-and-effect relationship. Ice cream sales and beach visits correlate because an external driver—hot weather—influences both.
- Accounting for Uncertainty: Estimates carry confidence bounds. The presence of a margin of error reflects realistic precision bounds rather than flawed data.
How can you identify misleading data?
To consistently build data literacy for beginners, learning how to identify misleading data is one of the most vital skills you can develop. Misleading data is not always deliberately false; it often results from incomplete records, poor measurement, or presentation without context.
Use this checklist when evaluating any dataset or report to strengthen your data literacy for beginners toolkit.
Audit the Data Source: Evaluating source credibility is a cornerstone of data literacy for beginners.
- Origin & Expertise: Verify who produced the data and whether they possess domain authority.
- Incentives: Assess if the author or organization is commercial, political, or promotional. A marketing whitepaper may highlight positive metrics while suppressing underperforming data.
- Traceability: Confirm if the original dataset, methodology, and publication date are publicly accessible and up to date.
Evaluate the Sample & Selection Bias. A fundamental rule in data literacy for beginners is that conclusions are only as strong as the sample behind them.
- Sample Scope: Check the overall sample size, geographic location, age demographics, and collection timeframe.
- Selection Method: Identify response rates and who was systematically excluded.
- Example: An online poll of 200 social media followers reflects only that specific audience—it cannot be generalized to an entire national population.
Verify the Denominator (Contextual Baselines). Comparing raw totals without a baseline is a common trap that strong data literacy for beginners helps you avoid. Always ask: “Out of how many?”
- Example: A large regional hospital may report more total recovery cases than a small clinic simply because it treats ten times as many patients. Comparing rates per 1,000 patients establishes a fair, normalized baseline.
Analyze the Timeframe Shortened or cherry-picked timeframes can create false trends.
- Check whether the reporting covers a single day, a quarter, a full year, or a seasonal peak.
- Ensure the period accounts for seasonal fluctuations, policy changes, or market disruptions to confirm a genuine long-term pattern.
Identify Missing Context & Visual Omissions. A core principle of data literacy for beginners is looking at what isn’t shown.
- Examine dashboards and charts for missing baseline comparisons, omitted historical data, excluded test failures, or hidden uncertainty ranges.
- Interactive dashboards are visually appealing, but they are only as accurate as the underlying metrics and data collection pipelines.
Watch for Measurement Bias Bias creeps into data through survey wording, selective category grouping, or flawed key performance indicators (KPIs).
- Flawed Business KPIs: Measuring only website clicks ignores whether those visitors convert into paying customers.
- Flawed Institutional KPIs: Evaluating a school exclusively on standardized test scores ignores attendance, student well-being, and resource accessibility.
A simple process for making data-informed decisions
Building practical data literacy for beginners requires a structured, repeatable framework to turn raw numbers into confident choices. Following a clear decision-making loop prevents analysis paralysis while ensuring your strategy rests on reliable evidence rather than gut feeling.
Define the Core Decision: Frame precise, focused questions.
Formulate the choice in a single, specific sentence.
- Vague: “What does our performance data look like?”
- Actionable: “Should we extend this advertising campaign for another month?”
A targeted premise isolates which metrics actually matter for your goal.
Establish Success Metrics: Select meaningful KPIs over easy targets.
Identify the specific outcome that signals success. Core metrics usually focus on cost reduction, profit margins, delivery speed, or customer satisfaction. Avoid tracking vanity metrics simply because they are convenient to collect.
Gather Relevant Data: Prioritize signal over raw volume.
Collect data strictly from verified sources, recording publication dates, exact units, known gaps, and methodological limits. Gathering excessive, poorly defined data creates noise rather than clarity.
Clean & Standardize Datasets: Normalize baselines for fair comparison.
Audit raw records for duplicates, missing fields, inconsistent formatting, or changed metric definitions. Compare like-for-like variables across identical timeframes, market regions, or customer cohorts.
Interpret Results Cautiously: Separate observed data from assumptions.
Distinguish between raw observations and hypothetical causes. If conversion rates drop post-redesign, do not instantly blame the UI layout—verify analytics setup, audit traffic quality, and test seasonal variances first.
Execute, Monitor, & Refine: Treat decision-making as an iterative cycle.
Match your action to the strength of your evidence. If data is limited or high-risk, execute a small, reversible test instead of a full rollout. Continually monitor your baseline metrics post-implementation to validate assumptions.
To apply data literacy for beginners effectively, treat this framework as a continuous feedback loop: every decision yields fresh data that refines your next choice.
How to build data literacy as a beginner
Building data literacy for beginners does not require enrolling in an advanced statistics program. You can develop strong data fluency through deliberate, practical habits using everyday tools.
Practice with Everyday Datasets The fastest way to advance data literacy for beginners is working with familiar, low-stakes numbers.
- Dataset Ideas: Monthly personal expenses, job applications sent, website traffic, or project delivery times.
- Action Steps: Calculate basic totals, averages, percentage changes, and create simple charts. Write three clear sentences summarizing the main insight from your visual.
Develop the “One Extra Question” Habit. Critical evaluation is the core of data literacy for beginners. Whenever you encounter a headline statistic, ask:
- What is the original source and sample size?
- Is this an exact total or an estimate with a margin of error?
- Does this show direct causation or simple correlation?
- What context or comparison group is missing?
Master Core Spreadsheet Functionality Tools like Google Sheets or Microsoft Excel provide everything needed for foundational analysis. Focus on mastering:
- Data Organization: Sorting, filtering, and data validation rules.
- Basic Functions: Sums, averages, percentages, and simple logical formulas (
IF). - Aggregation & Visualization: Pivot tables, bar graphs, and line charts.
Translate Data into Plain Language A crucial aspect of data literacy for beginners is communicating findings clearly to stakeholders. Every data summary should address six key elements:
- What Happened: The core trend or change observed.
- Scale: The exact magnitude of the shift (using percentage points or raw numbers).
- Scope: The specific timeframe, demographic, or department analyzed.
- Context: Plausible underlying drivers explaining the shift.
- Action: The recommended next step supported by evidence.
- Uncertainties: Remaining data gaps, risks, or caveats.
Common mistakes to avoid
Avoiding common analytical pitfalls is crucial when developing data literacy for beginners. Even well-intentioned analyses can lead to flawed strategy if underlying numbers or interpretations are accepted without critique.
Technical & Statistical Pitfalls
- Unquestioned Metric Reliability: Treating every number as an exact, unshakeable fact rather than evaluating its underlying source, methodology, or margin of error.
- Correlation vs. Causation Failure: Assuming two metrics that move together directly influence each other without considering external variable drivers.
- Skewed Metric Selection: Relying on the mean (average) when extreme outliers distort the central baseline, rather than opting for the median.
- Denominator & Scale Omissions: Comparing raw totals across unequal sample sizes instead of normalized rates, or evaluating a percentage without verifying the baseline number behind it.
- Over-Generalization: Assuming a small, niche, or biased sample accurately represents a broad, diverse population.
Visualization & Tool Pitfalls
- Visual Precision Illusions: Mistaking clean, visually attractive charts or dashboards for accurate underlying data pipelines.
- Source Blindness: Sharing or acting on visual summaries without checking the publication date, baseline axes, or original data origin.
- Single-Metric Reductionism: Attempting to compress complex operational outcomes (like overall employee performance or customer satisfaction) into a single KPI.
AI & Data Governance Pitfalls
- Unverified AI Summaries: Allowing artificial intelligence tools to calculate trends or summarize data without independently verifying the source inputs, logic, and output math.
- Governance Ignorance: When leveraging AI models for analysis, failing to account for privacy implications or risking the exposure of sensitive personal data.
Governance Standard: As highlighted in frameworks like the NIST AI Risk Management Framework, managing automated data risks requires verifying accuracy, transparency, and data privacy at every step of analysis.
Is data literacy for beginners difficult to learn?
No, the fundamentals of data literacy for beginners are straightforward and accessible. You do not need an advanced math background. You can start building fluency immediately by verifying chart axes, evaluating data origins, calculating basic percentage changes, and checking whether headline claims align with provided evidence.
Do I need to learn coding to build foundational data literacy?
No. While programming languages like Python or R are valuable for large-scale automation, beginners can build complete data literacy using standard spreadsheets (like Excel or Google Sheets) paired with critical reasoning.
Is data literacy the same as data analysis?
They overlap, but they are distinct concepts:
Data Analysis: The process of inspecting, cleaning, and modeling data to uncover specific patterns or technical insights.
Data Literacy: The broader ability to read, question, communicate, and responsibly apply data—focusing on context, data quality, ethics, and limitations.
What is the single most important skill in data literacy for beginners?
Asking critical questions is the most valuable core skill. Before accepting any metric, always clarify:
What exact unit or population was measured?
How and when was the data collected?
What context, denominator, or sample limitation might be missing?
What specific decision should this data inform?
Can data replace human judgment?
No. Data provides evidence, but it cannot make strategic choices for you. Datasets can be incomplete, outdated, or biased. Effective decision-making always pairs data insights with domain experience, contextual awareness, and ethical judgment.
In Conclusion
Data literacy for beginners is fundamentally about bridging the gap between raw numbers, contextual reality, and clear reasoning. By learning to read visual charts, distinguish percentages from percentage points, compare normalized baselines, and embrace uncertainty, you transform data into a reliable decision-making asset.
To put this guide into immediate practice, select a single small dataset you interact with daily—such as a month of personal expenses, job application responses, or website traffic—and answer these five foundational audit questions:
- Measurement: What exact metric, unit, and timeframe is being measured?
- Provenance: Where did the data originate, and how reliable is the collection method?
- Pattern: What primary trend, outlier, or correlation appears in the visual representation?
- Context: What missing variables, denominators, or potential biases could alter the conclusion?
- Action: What specific, low-risk decision can this evidence reasonably support?
Mastering data literacy for beginners isn’t an overnight technical transformation; it is a habit of structured curiosity that improves every professional and personal decision you make.