11 SQL Performance Monitoring Tools for Developers and DBAs
Database bottlenecks and unoptimized queries can silently degrade application performance, spike infrastructure costs, and ruin user experience. To maintain high availability and speed, SQL performance monitoring tools are essential for identifying slow queries, locking issues, and resource starvation in real time.
The right choice depends on your database platform—whether you run PostgreSQL, MySQL, SQL Server, Oracle, or a multi-platform stack—your budget, and whether you need lightweight query insights or deep, enterprise-grade diagnostics. This guide analyzes 11 practical options spanning commercial platforms, open-source utilities, and built-in database tools.
Who This Article Is For
- Developers: Build performant applications, troubleshoot slow queries, and catch N+1 query patterns early.
- Database Administrators (DBAs): Monitor, maintain, and optimize database health, indexing, and resource utilization across hybrid and cloud-native environments.
- DevOps & Platform Engineers: Integrate database telemetry into broader observability and infrastructure monitoring stacks.
- Data Analysts & IT Leaders: Evaluate scalable SQL performance monitoring tools to standardize observability across engineering teams.
What You Will Learn
- The core fundamentals of database performance observability.
- An unbiased breakdown of 11 top SQL performance monitoring tools, covering key features, supported engines, pricing models, and trade-offs.
- A decision framework for selecting the optimal tool based on your infrastructure and scale.
What Is SQL Performance Monitoring?
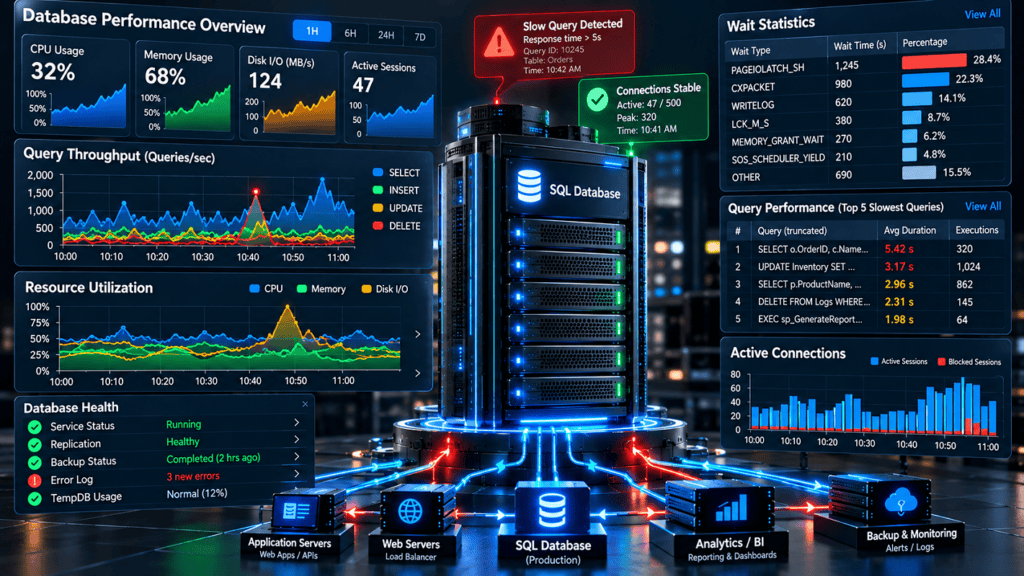
SQL performance monitoring is the continuous practice of tracking database health, query execution behavior, and resource utilization to identify and resolve performance bottlenecks before they impact users. Effective visibility relies on SQL performance monitoring tools to capture key telemetry across multiple layers:
- Resource Saturation:Tracking CPU usage, memory pressure, and disk I/O latency.
- Execution Behavior:Identifying slow-running queries, execution plan regressions, and high compilation rates.
- Concurrency & Contention:Analyzing wait statistics, blocking chains, and deadlocks.
Why It Matters
- Mitigating Application Latency:Unoptimized queries directly degrade system response times and ruin end-user experience.
- Preventing Outages:Resource bottlenecks (such as high CPU, memory exhaustion, or disk queues) can cause sudden timeouts or crashes.
- Resolving Concurrency Blocks:Active blocking and deadlocks halt critical transactions, necessitating immediate detection and intervention.
- Informing Capacity Planning:Historical performance trends provide the data required to forecast growth and scale infrastructure proactively.
From Monitoring to Action
Passive observation alone is insufficient. The most effective workflows link telemetry data directly to actionable remediation: query optimization, strategic index adjustments, configuration changes, and targeted infrastructure scaling.
How to Choose an SQL Performance Monitoring Tool
Selecting the right SQL performance monitoring tool requires balancing your technical stack, operational budget, and depth of diagnostics required. Before evaluating individual vendors, assess your environment against six core criteria:
- Database Platform: Are you locked into a single ecosystem (e.g., SQL Server, Oracle), or do you manage a polyglot stack (PostgreSQL, MySQL, distributed engines)?
- Deployment Architecture: Do your databases live on-premises, across managed cloud instances (AWS RDS, Azure SQL, GCP Cloud SQL), or in hybrid topologies?
- Team Composition & Scale: Are you an individual developer troubleshooting local queries, or an enterprise DBA team managing hundreds of mission-critical instances?
- Budget & Licensing: Are you looking for free/open-source utilities, mid-range subscription software, or enterprise-grade platforms with volume-based pricing?
- Diagnostic Depth: Do you need basic slow-query logging, advanced wait-state analysis, or full-stack Application Performance Monitoring (APM) correlation?
- Compliance & Governance: Do you require built-in audit trails, data masking, security monitoring, or strict data residency controls?
Note
The comparison table and tool breakdown below evaluate 11 top SQL performance monitoring tools across these dimensions. Pricing remains indicative—always verify current enterprise licensing structures and tiers directly with vendors before committing.
11 SQL Performance Monitoring Tools Compared
The table below provides a high-level comparison of 11 leading SQL performance monitoring tools, spanning commercial enterprise suites, open-source platforms, and native cloud utilities.
| Tool | Type / Cost (Indicative) | Supported Databases | Best For | Key Strengths / Limitations |
| SolarWinds DPA | Commercial From ~$1,995/yr or $117–$142/db/mo | SQL Server, Oracle, MySQL, PostgreSQL, Azure SQL, AWS RDS | Enterprises & DBAs needing cross-platform deep analysis | Wait-based analysis, tuning advisors, historical baselines, multi-platform support Premium pricing; may be overkill for small teams |
| Datadog DBM | Commercial (SaaS) $70/db host/mo (annual) or $84/mo (on-demand) | PostgreSQL, MySQL, SQL Server, Oracle, MongoDB, ClickHouse, more | Cloud-native teams using full-stack observability | AI-powered root cause, query insights, unified with APM/logs, wide database support Costs add up quickly; separate billing from infrastructure hosts |
| Redgate Monitor | Commercial From ~$1,164/yr (1–4 servers); ~$1,495/yr per server | SQL Server, PostgreSQL, Azure SQL, AWS RDS for SQL Server | SQL Server-focused teams needing deep diagnostics | Adaptive baselines, deadlock visualization, prescriptive alerts, history browser Primarily SQL Server; PostgreSQL support newer and less mature |
| IDERA SQL Diagnostic Manager | Commercial From ~$1,247/yr per instance; perpetual from ~$2,445 | SQL Server (on-prem, Azure SQL, AWS RDS, GCP) | SQL Server estates needing agentless, per-instance pricing | Agentless, owns data repository, AI insights, dimensional wait stats, forecasting SQL Server only; perpetual licenses expensive upfront |
| Quest Foglight for Databases | Commercial From ~$499/yr; custom per-instance/per-platform pricing | SQL Server, Oracle, MySQL, PostgreSQL, DB2, SAP, MongoDB, etc. (14+ engines) | Heterogeneous database estates in enterprises | Cross-platform (14+ databases), Query Insights, AI Alarms, change tracking, cloud support Pricing not transparent; AI features may require per-seat add-ons |
| Percona PMM | Open Source (Free) Free (self-hosted); enterprise support available | MySQL, PostgreSQL, MongoDB | Teams using MySQL/PostgreSQL/MongoDB wanting free, self-hosted observability | Query Analytics (QAN), Grafana dashboards, no ingest fees, full control Self-hosting overhead; limited to MySQL/PostgreSQL/MongoDB |
| New Relic Database Monitoring | Commercial (Usage-based) 100 GB free/mo; then $0.30–$0.55/GB + user tiers ($0–$349/user/mo) | PostgreSQL, MySQL, SQL Server, Oracle, MongoDB, more | Teams already using New Relic for APM/infra observability | Unified observability, flexible usage pricing, AI features, 100 GB free tier Costs scale with data volume; complex pricing for large ingest |
| EverSQL | Freemium / AI-powered Free tier (1 optimization/mo); Starter $79–$129/mo; Enterprise $1,799+/mo | PostgreSQL, MySQL | Developers wanting AI query optimization + lightweight monitoring | AI query rewriting, index recommendations, non-intrusive sensor, free tier Only PostgreSQL/MySQL; deeper monitoring tied to Aiven platform |
| Prometheus + Grafana | Open Source (Free) Free (self-hosted); costs for infrastructure/storage | Any (via exporters: MySQL, PostgreSQL, SQL Server, Oracle, MongoDB, etc.) | DevOps teams comfortable with self-hosted, customizable monitoring | Highly customizable, vast exporter ecosystem, no licensing costs, scalable Requires setup/maintenance; no built-in query tuning; DIY alerting/dashboards |
| pgAdmin | Open Source (Free) Free | PostgreSQL, EDB Postgres Advanced Server | PostgreSQL developers needing free admin + basic monitoring | Official PostgreSQL tool, query tool with EXPLAIN, server dashboards, free Basic monitoring only; not designed for fleet-scale or advanced alerting |
| Azure SQL Query Performance Insight | Built-in (Free with Azure SQL) Free (included with Azure SQL Database/Managed Instance) | Azure SQL Database, Azure SQL Managed Instance | Teams using Azure SQL needing built-in query analysis | No setup, uses Query Store, top queries by CPU/duration, visual analysis Azure SQL only; less depth than dedicated third-party tools |
Deep Dive into the Top Tools
To help you evaluate which platform fits your operational model, the 11 tools break down into distinct categories based on deployment, tech stack, and budget.
Enterprise Cross-Platform Monitors
- SolarWinds Database Performance Analyzer (DPA): Renowned for its multi-dimensional wait-state analysis. Instead of just tracking CPU and memory, DPA correlates wait times with exact query statements, making it a gold standard for complex, mixed-vendor enterprise environments.
- Quest Foglight for Databases: Supports over 14 database platforms, making it ideal for large heterogeneous organizations that need unified performance tracking across relational databases and NoSQL systems alike.
Specialized SQL Server & Cloud Ecosystem Leaders
- Redgate SQL Monitor: The premier choice for Microsoft SQL Server environments. It offers exceptional deadlock visualization, alerting precision, and adaptive baselines that learn normal system behavior to minimize false positives.
- IDERA SQL Diagnostic Manager: A robust, agentless monitoring solution tailored for SQL Server estates. It excels at real-time diagnostic snapshots, forecasting resource trends, and delivering deep performance metrics without software overhead on the database host.
- Azure SQL Query Performance Insight: An out-of-the-box utility built into Azure SQL. By leveraging the underlying Query Store, it provides immediate visibility into resource-heavy queries without requiring external installations.
Full-Stack Observability & Cloud-Native Platforms
- Datadog Database Monitoring (DBM): Combines deep query-level telemetry with complete infrastructure and application performance monitoring (APM). Ideal for cloud-native teams looking to trace a slow API call down to the exact database execution plan.
- New Relic Database Monitoring: A usage-based observability platform that unifies database telemetry with application logs and traces. Its generous free tier (100 GB/month) makes it accessible for growing engineering teams.
Open-Source, Self-Hosted & Specialized Utilities
- Percona Monitoring and Management (PMM): The leading open-source solution for MySQL, PostgreSQL, and MongoDB. It provides rich query analytics (QAN) and Grafana-powered visualization entirely free of licensing fees for self-hosted infrastructures.
- Prometheus + Grafana: The ultimate choice for DevOps teams who prefer complete infrastructure control. By deploying exporters, engineering teams can scrape custom database metrics and build tailored dashboards without vendor lock-in.
- pgAdmin: A dependable, free utility tailored specifically for PostgreSQL developers who need immediate administrative tooling alongside query execution analysis (
EXPLAINplans). - EverSQL: A modern, AI-powered optimization tool. Rather than focusing strictly on infrastructure health, EverSQL acts as an intelligent assistant that automatically rewrites sluggish SQL queries and suggests missing indexes.
When selecting among these SQL performance monitoring tools, align your choice with your operational bottleneck:
- If you operate a Microsoft-centric stack: Redgate Monitor or IDERA offer unmatched depth.
- If you manage a multi-cloud, polyglot environment: Datadog or SolarWinds DPA provide the necessary cross-platform visibility.
- If budget is tight and your team has infrastructure bandwidth: Percona PMM or Prometheus + Grafana deliver enterprise-grade metrics at zero licensing cost.
SolarWinds Database Performance Analyzer (DPA)
SolarWinds DPA is an enterprise-grade, cross-platform SQL performance monitoring tool built on a multi-dimensional wait-state analysis engine. It provides deep visibility into database bottlenecks across SQL Server, Oracle, MySQL, PostgreSQL, and major cloud relational services.
- Core Features:
- Response Time Analysis (RTA): Correlates wait statistics across exact queries, users, applications, and client machines to isolate root causes.
- Prescriptive Tuning Advisors: Delivers actionable recommendations for query rewrites, index creation, and configuration adjustments.
- Historical Baselines & Anomaly Detection: Dynamically learns normal performance curves to automatically flag deviations without manual threshold tuning.
- Hybrid & Cloud Flexibility: Deploys seamlessly across on-premises servers, virtualized instances, AWS RDS, and Azure SQL databases.
- Pricing & Licensing: Starts at approximately $1,995/year or $117–$142 per database instance/month on annual agreements. A 14-day fully functional trial is available.
- Ideal Use Case: Enterprise database administrators and operations teams managing complex, heterogeneous database estates requiring rigorous, multi-vendor diagnostic depth.
- Limitations: Premium pricing structures can be cost-prohibitive for small teams or mid-market budgets; the dense feature set may represent over-engineering for simple, single-engine monitoring needs.
Datadog Database Monitoring (DBM)
Datadog Database Monitoring (DBM) is a cloud-native, AI-powered SQL performance monitoring tool integrated directly into Datadog’s broader observability ecosystem. It unifies deep query telemetry with APM, infrastructure metrics, and logs to trace performance bottlenecks from the application layer down to the underlying database engine.
- Core Features:
- Normalized Query Metrics & PII Obfuscation: Automatically aggregates query performance data while scrubbing sensitive personally identifiable information (PII) to comply with data privacy standards.
- AI-Powered Root Cause Analysis: Leverages machine learning to surface abnormal query behavior, pinpoint performance anomalies, and generate automated query optimization recommendations.
- Comprehensive Diagnostics: Provides real-time and historical query execution views, deep blocking chain analysis, and native visual explain plans.
- Broad Engine Support: Covers a wide spectrum of relational and non-relational engines, including PostgreSQL, MySQL, SQL Server, Oracle, MongoDB, ClickHouse, Amazon DocumentDB, and Supabase.
- Pricing & Licensing: Priced at $70 per database host per month on an annual commitment, or $84 per month on-demand. Note that DBM is billed separately from standard infrastructure hosts and other Datadog modules.
- Ideal Use Case: Cloud-native engineering and platform teams already standardized on Datadog for APM and infrastructure monitoring who require end-to-end trace correlation.
- Limitations: Subscription costs can escalate rapidly as database fleets grow; separate billing structures for hosts, APM, and DBM add complexity to cost forecasting and budget management.
Redgate Monitor (Redgate SQL Monitor)
Redgate Monitor is an industry-leading, SQL Server-focused SQL performance monitoring tool engineered to provide deep database diagnostics, proactive alerting, and granular forensic analysis. While expanding to support other ecosystems, its core strength lies in optimizing Microsoft SQL Server estates.
- Core Features:
- Adaptive Baselines: Automatically learns normal performance thresholds for each individual server to eliminate false-positive alerts and highlight true anomalies.
- Visual Deadlock Analysis: Captures precise evidence, process trees, and transaction details the moment deadlocks occur to accelerate troubleshooting.
- Dimensional Wait Statistics: Breaks down performance drag across specific databases, applications, user accounts, and individual queries.
- Capacity Forecasting: Predicts future storage constraints by modeling trends in disk space, database growth, and table expansion.
- Comprehensive History Browser: Retains granular performance data for forensic post-mortems and long-term trend analysis.
- Pricing & Licensing: Standard pricing starts at approximately $1,164/year for bundles of 1 to 4 servers, scaling to about $1,495/year per server for larger installations. Custom enterprise tiers are also available, and a 14-day free trial is provided.
- Ideal Use Case: Microsoft SQL Server database administrators and enterprise teams requiring agentless visibility, historical auditing, and prescriptive optimization advice.
- Limitations: Highly specialized for the Microsoft ecosystem; its PostgreSQL monitoring capabilities are newer and lack the long-term maturity of its SQL Server engine.
IDERA SQL Diagnostic Manager
IDERA SQL Diagnostic Manager (SQL DM) is a robust, agentless SQL performance monitoring tool built specifically for Microsoft SQL Server estates. It provides real-time diagnostics, AI-driven recommendations, and a customer-hosted data repository for long-term forensic analysis across on-premises, hybrid, and multi-cloud environments.
- Core Features:
- Agentless Architecture: Monitors database performance with minimal resource overhead, eliminating the need to install software directly on monitored database hosts.
- Deadlock & Concurrency Analysis: Instantly captures, visualizes, and diagnoses blocking chains and deadlocked transactions.
- Dimensional Wait Statistics: Granular breakdown of performance bottlenecks categorized by database, user, application, and specific query statements.
- AI-Powered Prescriptive Guidance: Automatically analyzes performance trends and offers targeted query optimization suggestions.
- Customer-Owned Data Repository: Stores all historical monitoring telemetry in your own database instance, supporting multi-year trend analysis and custom reporting without third-party data ingest fees.
- Forecasting & Capacity Planning: Projects future disk space, storage growth, and hardware capacity needs based on historical consumption patterns.
- Pricing & Licensing: Subscription pricing starts around $1,247 per instance/year, with perpetual licenses starting around $2,445 (including 1-year maintenance). A fully functional 14-day free trial is available.
- Ideal Use Case: Organizations managing Microsoft SQL Server workloads across on-premises servers, Azure SQL, AWS RDS, or GCP who prefer predictable per-instance pricing and complete ownership of their monitoring data.
- Limitations: Strictly limited to the SQL Server ecosystem; perpetual licensing models require a higher upfront capital expenditure compared to modern SaaS subscription alternatives.
Quest Foglight for Databases
Quest Foglight for Databases is a comprehensive, cross-platform SQL performance monitoring tool designed to support heterogeneous database environments. Spanning over 14 relational and NoSQL engines—including SQL Server, Oracle, MySQL, PostgreSQL, DB2, SAP, and MongoDB—it provides a single pane of glass for enterprise database observability.
- Core Features:
- Query Insights Engine: Ranks resource-intensive queries by overall impact to immediately focus tuning efforts on the highest-leverage bottlenecks.
- AI Alarms & AI Optimize: Leverages built-in machine learning to automate root-cause analysis, establish predictive baselines, and surface prescriptive tuning recommendations.
- Automated Change Tracking: Continuously monitors and logs modifications across servers, instances, databases, and underlying database schemas to correlate environmental shifts with performance drops.
- Baseline-Deviation Alerting: Dynamic alerting frameworks flag unusual deviations from historical behavioral patterns rather than rigid, manual static thresholds.
- Multi-Cloud and Hybrid Support: Out-of-the-box monitoring capabilities for on-premises systems alongside major cloud database services like Amazon RDS and Azure SQL.
- Pricing & Licensing: Entry-level pricing starts around $499/year, with customized pricing models dependent on specific instances and database platforms. A generous 45-day free trial is available for evaluation.
- Ideal Use Case: Large enterprises and managed service providers running diverse, multi-engine database stacks who require unified monitoring, auditing, and performance diagnostics across disparate platforms.
- Limitations: Public pricing transparency is limited for enterprise tiers; advanced AI functionality and specialized cartridge extensions may require additional per-seat or per-engine licensing add-ons.
Percona Monitoring and Management (PMM)
Percona Monitoring and Management (PMM) is an enterprise-grade, free, and open-source SQL performance monitoring tool designed specifically for MySQL, PostgreSQL, and MongoDB environments. It delivers comprehensive database observability, query analytics, and infrastructure metrics without proprietary software licensing fees.
- Core Features:
- Query Analytics (QAN): A powerful interface for isolating slow-running queries, evaluating execution frequency, and drilling down into load distribution across clusters.
- Grafana-Powered Dashboards: Utilizes native Grafana integration to provide highly customizable, visually rich operational dashboards for real-time visualization.
- Complete Data Ownership: Operates on a self-hosted architecture with zero ingest fees, allowing organizations to retain full control over data retention policies and telemetry storage.
- Multi-Engine & Cluster Support: Deep, native performance monitoring for open-source relational databases (MySQL, PostgreSQL) and document databases (MongoDB).
- Pricing & Licensing: 100% free and open-source for self-hosted deployments. Optional enterprise-grade support, consulting, and fully managed services are available commercially through Percona.
- Ideal Use Case: Engineering and DBA teams heavily reliant on MySQL, PostgreSQL, or MongoDB who want robust, production-ready observability without licensing costs or cloud-vendor lock-in.
- Limitations: Requires internal engineering bandwidth for self-hosting setup, patching, and long-term maintenance; strictly limited to MySQL, PostgreSQL, and MongoDB engines.
New Relic Database Monitoring
New Relic Database Monitoring is an integrated pillar of New Relic’s full-stack observability platform. It delivers granular database telemetry alongside application performance monitoring (APM), infrastructure metrics, and logs, utilizing a usage-based pricing model and a generous data-free tier.
- Core Features:
- Full-Stack Correlation: Unifies database metrics directly with APM traces, error logs, and user-facing synthetic monitoring to trace performance bottlenecks across the entire application stack.
- Generous Free Ingest Tier: Includes 100 GB of free data ingest per month across accounts, lowering the barrier to entry for smaller engineering teams.
- AI-Powered Insights: Leverages built-in artificial intelligence to surface performance anomalies, identify slow queries, and streamline troubleshooting.
- Broad Engine Support: Monitors a wide variety of database platforms including PostgreSQL, MySQL, SQL Server, Oracle, and MongoDB.
- Pricing & Licensing: Includes 100 GB of free data per month. Additional ingest ranges from $0.30 to $0.55 per GB depending on the tier (Original vs. Data Plus), combined with user-tier seat pricing ($0 to $349 per user per month).
- Ideal Use Case: Engineering organizations already standardized on New Relic for application and infrastructure observability who want to integrate SQL performance monitoring tools without introducing an independent vendor stack.
- Limitations: Costs can scale unpredictably as telemetry data volume grows; multi-layered pricing structures (combining data ingest rates and user tiers) can complicate budget forecasting for high-throughput environments.
EverSQL
EverSQL is an AI-powered SQL performance monitoring tool and query optimizer tailored specifically for PostgreSQL and MySQL environments. Acquired by Aiven, it bridges the gap between lightweight database monitoring and automated query tuning by leveraging machine learning to rewrite sluggish queries and recommend optimal indexes.
- Core Features:
- AI-Driven Query Rewriting & Indexing: Automatically analyzes slow execution plans and rewrites complex SQL statements or suggests missing indexes to radically improve execution times.
- Non-Intrusive Monitoring Sensor: Deploys a lightweight telemetry sensor to continuously monitor production query performance without introducing noticeable latency or infrastructure overhead.
- Cost & Resource Reduction: Identifies redundant indexes, unused objects, and schema inefficiencies that waste storage and CPU cycles.
- PostgreSQL & MySQL Specialization: Deeply optimized for open-source relational engines, providing granular insights tailored to their specific execution planners.
- Pricing & Licensing: Offers a limited free tier (1 optimization per month). Paid plans range from $79 to $129 per month for the Starter tier (up to 500 optimizations) up to $1,799+ per month for Enterprise-grade plans.
- Ideal Use Case: Application developers and engineering teams managing PostgreSQL or MySQL workloads who need automated, AI-driven query tuning rather than complex, heavy infrastructure monitoring.
- Limitations: Strictly limited to PostgreSQL and MySQL platforms; advanced, continuous monitoring capabilities are increasingly tied into the broader Aiven data platform ecosystem.
Prometheus + Grafana (with Database Exporters)
The combination of Prometheus (for metric collection and time-series storage) and Grafana (for visualization and alerting) forms a powerful open-source observability stack. By deploying specialized database exporters (such as mysqld_exporter or postgres_exporter), this stack functions as a flexible SQL performance monitoring tool capable of scraping and displaying deep database telemetry.
- Core Features:
- Extensible Exporter Ecosystem: Native support for scraping performance metrics across nearly every major engine—including MySQL, PostgreSQL, Microsoft SQL Server, Oracle, and MongoDB—using community and official exporters.
- Infinite Customization: Empowers teams to build bespoke dashboards, complex multi-variable panels, and highly granular alerting rules tailored to exact operational thresholds.
- Zero Licensing Costs: Completely free and open-source, giving organizations full control over data retention policies, storage backends, and scaling architecture.
- Cloud-Native & Container Integration: Seamlessly integrates with Kubernetes, Docker, and modern containerized or cloud-based infrastructure.
- Pricing & Licensing: 100% free and open-source for self-hosted deployments. Expenses are strictly limited to underlying infrastructure (hosting servers, persistent storage) and internal engineering maintenance hours.
- Ideal Use Case: DevOps and platform engineering teams with existing infrastructure expertise who want complete architectural control, custom dashboards, and zero vendor licensing fees for SQL performance monitoring tools.
- Limitations: Requires significant setup, ongoing maintenance, and domain expertise to configure; lacks built-in query tuning advisors, automated execution plan analysis, or out-of-the-box prescriptive recommendations.
pgAdmin (PostgreSQL)
pgAdmin is the official, open-source administration and development platform for PostgreSQL. While primarily designed for database management and query development, it includes built-in dashboards and diagnostic features that function as a lightweight SQL performance monitoring tool for individual instances.
- Core Features:
- Advanced Query Tool: Features syntax highlighting, auto-completion, and a graphical
EXPLAINplan visualizer to help developers inspect query execution paths. - Live Server Dashboards: Real-time visibility into active server sessions, row-level locks, transaction activity, and resource consumption.
- Comprehensive Object Browser: Centralized management interface for navigating servers, databases, schemas, tables, roles, and installed extensions.
- Built-In Maintenance Wizards: Seamlessly handles database backups and restores by wrapping native utilities like
pg_dumpandpg_restore.
- Advanced Query Tool: Features syntax highlighting, auto-completion, and a graphical
- Pricing & Licensing: 100% free and open source under the PostgreSQL License, with no paid tiers or commercial restrictions.
- Ideal Use Case: PostgreSQL developers and database administrators requiring a free, official GUI for daily administration, query authoring, and basic, single-server performance troubleshooting.
- Limitations: Limited to basic, point-in-time monitoring; lacks the advanced alerting, fleet-scale centralization, multi-server aggregation, and long-term historical trend analysis required for large enterprise environments.
Azure SQL Query Performance Insight
Azure SQL Query Performance Insight is a native, built-in monitoring feature for Azure SQL Database and Azure SQL Managed Instance. By leveraging the underlying Azure SQL Query Store, it provides immediate visibility into the top resource-consuming queries without requiring external agents or third-party infrastructure.
- Core Features:
- Resource Consumption Ranking: Instantly surfaces top queries categorized by CPU consumption, execution duration, and total execution count.
- Historical Utilization Trends: Tracks performance consumption curves over custom time intervals to spot regressions or sudden spikes.
- Deep Query Drill-Down: Inspects full query text, historical execution metrics, and plan variations for individual statements.
- Performance Recommendation Annotations: Highlights automated tuning or index recommendations provided directly by the Azure SQL engine.
- Pricing & Licensing: 100% free, included natively with Azure SQL Database and Azure SQL Managed Instance.
- Ideal Use Case: Development and DBA teams operating within the Azure cloud ecosystem who need immediate, zero-setup query analysis without additional software licensing costs.
- Limitations: Restricted exclusively to Azure SQL workloads; lacks the advanced multi-dimensional wait-state analysis, fleet-wide aggregation, and cross-platform correlation found in dedicated third-party SQL performance monitoring tools.
That completes the 11 individual tool breakdowns! Would you like to move on to compiling the conclusion, evaluation framework, or putting the full article together?
Free vs. Paid Tools: Which Should You Choose?
Selecting between free, open-source, and paid commercial SQL performance monitoring tools depends entirely on your team’s scale, infrastructure complexity, operational budget, and internal maintenance bandwidth.
The reference matrix below maps out common organizational scenarios to the most appropriate monitoring solutions:
| Scenario | Recommended Tools |
| Individual developer or small team on a tight budget | pgAdmin (PostgreSQL), Azure SQL Query Performance Insight (Azure SQL), EverSQL (Free tier), Percona PMM (Self-hosted), Prometheus + Grafana (Self-hosted) |
| Startup or scale-up with a cloud-native stack | Datadog DBM, New Relic Database Monitoring, EverSQL (Starter/Enterprise), Percona PMM (for MySQL/PostgreSQL/MongoDB fleets) |
| SQL Server-focused enterprise | Redgate Monitor, IDERA SQL Diagnostic Manager, SolarWinds DPA, Quest Foglight for SQL Server |
| Heterogeneous database estate (multi-platform) | SolarWinds DPA, Quest Foglight for Databases, Datadog DBM, New Relic Database Monitoring |
| DevOps team prioritizing self-hosted control | Percona PMM, Prometheus + Grafana, pgAdmin (PostgreSQL-only) |
Strategic Evaluation Guidelines
- Choose Free / Open-Source (e.g., PMM, Prometheus + Grafana) when: You have dedicated DevOps resources to manage the monitoring infrastructure, require zero software licensing overhead, and operate standardized database engines like PostgreSQL, MySQL, or MongoDB.
- Choose Paid Commercial Tools (e.g., Redgate, IDERA, Datadog) when: You manage mission-critical enterprise estates, require out-of-the-box alerting and advanced compliance features, or need deep multi-dimensional wait-state analysis that justifies the licensing cost through reduced downtime and accelerated troubleshooting.
Common Mistakes to Avoid
When selecting and implementing SQL performance monitoring tools, avoiding strategic missteps ensures your team invests time and capital effectively:
- Choosing a tool based on features alone: A feature-rich platform is useless if it lacks native support for your specific database versions, engine variants, or hybrid deployment models.
- Ignoring total cost of ownership (TCO): Commercial tools often carry hidden expenses, such as per-host ingest data fees, separate infrastructure charges, or per-seat add-ons. Conversely, open-source utilities trade licensing fees for significant internal engineering overhead.
- Overlooking data ownership and compliance: SaaS-based monitors transmit query and performance telemetry to third-party clouds. Always audit data residency, in-transit encryption, and strict regulatory requirements (GDPR, HIPAA, SOC 2).
- Focusing only on observation rather than optimization: Raw metrics without context create noise. The right tools bridge the gap between detection and execution by providing query rewrites, index recommendations, and configuration tuning.
- Neglecting alert fatigue: Setting up rigid, static thresholds leads to constant false alarms. Prioritize tools equipped with adaptive baselines, intelligent anomaly detection, and precise alerting filters.
Practical Next Steps
To transition from evaluation to execution, follow this structured rollout framework:
- Inventory Your Databases: Catalog your entire database estate, documenting exact engines, minor versions, and deployment topologies (on-premises, AWS RDS, Azure SQL, or hybrid).
- Define Core Monitoring Objectives: Isolate your top 3 to 5 operational bottlenecks—whether that involves tracking slow-running queries, resolving recurring deadlocks, mitigating CPU spikes, or proactive capacity planning.
- Shortlist 2 to 3 Tools: Filter the 11 platforms covered in this guide based on your exact budget, team composition, and stack requirements using the comparison matrices above.
- Execute Proof-of-Concept Trials: Leverage 14- to 45-day free trials to test shortlisted tools against live, representative workloads to evaluate dashboard clarity, setup friction, and query insight depth.
- Establish an Optimization Cadence: Once telemetry is active, schedule regular engineering reviews focused on query tuning, redundant index removal, and architectural capacity expansion.
What is the best free SQL performance monitoring tool?
The ideal free option depends entirely on your database engine and infrastructure setup:
For PostgreSQL: pgAdmin offers built-in server dashboards, live session tracking, and graphical execution plans.
For MySQL, PostgreSQL, and MongoDB: Percona PMM delivers robust, self-hosted enterprise observability complete with advanced Query Analytics (QAN) and Grafana visualization.
For Azure SQL: Query Performance Insight comes native and free, utilizing the underlying Query Store to rank queries by CPU and duration.
For DevOps & Platform Teams: Prometheus + Grafana (paired with standard database exporters) provides an infinitely customizable, scalable free stack.,
Which tool is best for SQL Server?
For Microsoft SQL Server environments, Redgate Monitor and IDERA SQL Diagnostic Manager are industry benchmarks, providing deep agentless diagnostics, visual deadlock analysis, and adaptive baselines. Enterprise organizations managing mixed Microsoft workloads also frequently rely on SolarWinds DPA or Quest Foglight for SQL Server.
Can I monitor multiple database platforms with one tool?
Yes. If your stack is polyglot or heterogeneous, tools like SolarWinds DPA, Quest Foglight for Databases, Datadog DBM, and New Relic Database Monitoring provide unified monitoring across relational and NoSQL engines including SQL Server, PostgreSQL, MySQL, Oracle, and MongoDB.
How much do SQL performance monitoring tools cost?
Pricing spans several distinct tiers based on architecture and scale:
Free / Open-Source: pgAdmin, Percona PMM, Prometheus + Grafana, and native cloud utilities like Azure’s Query Performance Insight.
Mid-Range: EverSQL Starter tiers ($79–$129/month), Redgate SQL Monitor (~$1,164–$1,495/year), and IDERA SQL DM (~$1,247/year per instance).
Enterprise SaaS & Commercial: SolarWinds DPA (~$1,995+/year), Datadog DBM ($70–$84 per database host/month), and custom-priced enterprise licenses like Quest Foglight.
Do I need a dedicated DBA to use these tools?
No. While enterprise platforms like Redgate, IDERA, and SolarWinds offer deep diagnostics tailored for seasoned DBAs, modern tools provide built-in prescriptive guidance, AI-driven query rewrites (such as EverSQL), or zero-setup cloud insights (such as Azure SQL Query Performance Insight) that empower standard software developers to diagnose and resolve performance issues quickly.
In Conclusion
SQL performance monitoring is non-negotiable for engineering and database teams aiming to eliminate slow-running queries, resolve locking conflicts, and prevent resource exhaustion before user experience is compromised.
- Platform & Architecture Alignment: The right tool is entirely contingent on your underlying engine (SQL Server, PostgreSQL, MySQL, Oracle, or multi-platform) and your deployment model (on-premises, cloud-native, or hybrid).
- Balancing Cost & Capability: Commercial powerhouses—such as SolarWinds DPA, Datadog DBM, Redgate Monitor, IDERA SQL DM, and Quest Foglight—deliver deep enterprise diagnostics and automated prescriptive guidance at a licensing cost. Conversely, open-source and native alternatives like Percona PMM, Prometheus + Grafana, pgAdmin, and Azure SQL Query Performance Insight provide exceptional value for teams equipped to handle self-hosting or leverage built-in cloud telemetry.
Final Takeaway
Do not choose a tool on feature checklists alone. Shortlist two to three options that match your budget and stack, launch a hands-on proof-of-concept trial using your actual production workloads, and establish a continuous cadence of query optimization and capacity planning.