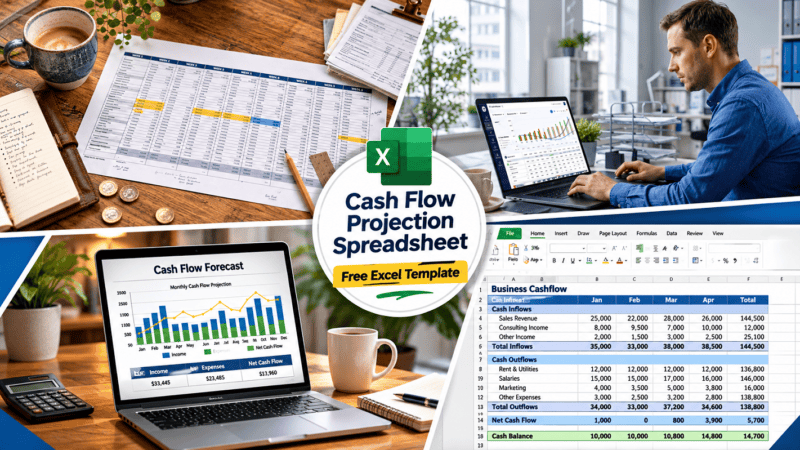
Cash Flow Forecast Spreadsheet: A Basic Guide for Businesses
Maintaining financial visibility is the single most critical factor separating businesses that survive early volatility from those that fail due to liquidity crunches. A robust cash flow forecast spreadsheet eliminates guesswork by systematically mapping out expected monetary inflows, outflows, and net positions over defined operational horizons.
Whether you are managing irregular client disbursements or scaling fixed overhead, implementing a structured cash flow forecast spreadsheet allows you to preemptively identify deficit windows, optimize working capital, and make confident capital allocation decisions. This guide outlines the core architecture of a cash flow forecast spreadsheet, details essential formula mechanics, and provides an actionable framework to maintain an accurate, forward-looking view of your business liquidity.
What Is a Cash Flow Forecast Spreadsheet?
A cash flow forecast spreadsheet is a dynamic financial planning tool that projects future monetary receipts and disbursements over a specific operational horizon. By mapping expected inflows against upcoming commitments, it gives business owners clear visibility into whether available liquid assets will cover upcoming liabilities.
A foundational cash flow forecast spreadsheet architecture relies on five core line items:

- Opening Cash Balance: The liquid capital available at the start of the period.
- Expected Cash Inflows: Anticipated revenue receipts, accounts receivable collections, and external funding injections.
- Expected Cash Outflows: Fixed overhead, payroll, supplier invoices, tax obligations, and operating expenses.
- Net Cash Flow: The variance between total inflows and total outflows for the given period.
- Projected Closing Cash Balance: The resulting liquid position at the end of the period, which rolls over as the opening balance for the next cycle.
Temporal Granularity
Forecasting intervals should match the operational volatility and burn rate of the business:
- Weekly Granularity: Essential for businesses operating on tight reserves where misaligned payroll cycles or delayed supplier payments create immediate insolvency risks.
- Monthly or Quarterly Granularity: Suitable for stable businesses or freelancers managing predictable subscription revenue and seasonal fluctuations.
Important Distinction
A cash flow forecast spreadsheet models anticipated liquidity based on transaction timing and assumptions—it is a probabilistic planning model, not an audited guarantee of future cash availability.
Why Businesses Need a Cash Flow Forecast Spreadsheet
Profitability and liquidity are distinct financial metrics; a business can generate strong paper sales on an accrual basis yet still face insolvency if customer payment terms lag behind immediate overhead obligations. Implementing a dedicated cash flow forecast spreadsheet bridges this gap by mapping the precise timing of capital movements, protecting operations against structural volatility.
Identify Potential Cash Shortages Early
A well-structured cash flow forecast spreadsheet highlights deficit windows before they materialize into missed payrolls or bounced vendor checks. By visualizing dipping liquid balances weeks in advance, management gains the runway required to take corrective action—such as incentivizing early customer payments via discounts, renegotiating supplier terms, deferring non-essential capital expenditures, or securing bridge financing.
Calibrate Expenses and Expansion Velocity
Scaling prematurely is a primary driver of startup failure. Before committing to fixed costs—such as hiring full-time headcount, expanding commercial real estate, or ramping up paid acquisition budgets—leadership can use a cash flow forecast spreadsheet to stress-test future cash positions against these investments. This ensures growth initiatives are funded by sustainable operational cash flow rather than depleting vital safety reserves.
Monitor Precise Cash Runway
While a basic runway metric provides a macro view of monthly burn rates, it often masks intra-month volatility. A granular cash flow forecast spreadsheet accounts for specific calendar dates when major lump-sum outflows (like quarterly tax installments or annual software licensing) coincide with lumpy client disbursements, giving founders an accurate, time-weighted picture of operational survival.
Streamline Capital and Financing Discussions
External stakeholders, investors, and lending institutions—including the U.S. Small Business Administration (SBA)—routinely require robust financial projections during funding evaluations. Integrating a polished cash flow forecast spreadsheet into a funding application demonstrates professional financial governance, precisely quantifying external capital requirements, peak deficit timing, and repayment capacity.
Core Components of a Cash Flow Forecast Spreadsheet
An effective cash flow forecast spreadsheet relies on a clear, modular architecture that separates operational inflows, operational outflows, and liquid balances. Structuring your model logically ensures rapid auditing, seamless formula replication, and accurate monthly rollovers.
| Spreadsheet Component | Purpose & Description |
| Opening Cash Balance | Liquid capital available at the absolute start of the forecasting period (automatically pulls the prior period’s closing balance). |
| Customer Receipts | Expected cash payments collected from clients and accounts receivable during the current period. |
| Other Cash Inflows | Secondary revenue streams, asset sales, tax refunds, or external funding injections. |
| Total Cash Inflows | Aggregate sum of all expected monetary receipts for the period. |
| Operating Expenses | Fixed and variable overhead costs, including rent, utilities, SaaS tools, and marketing. |
| Payroll | Total cash committed to employee salaries, contractor fees, and associated benefits. |
| Supplier Payments | Expected disbursements made to vendors and inventory providers based on payable terms. |
| Taxes & Debt Repayments | Scheduled statutory tax remittances and principal/interest loan service obligations. |
| Other Cash Outflows | Uncategorized or discretionary capital expenditures and miscellaneous outflows. |
| Total Cash Outflows | Aggregate sum of all expected monetary disbursements for the period. |
| Net Cash Flow | The variance between Total Cash Inflows and Total Cash Outflows (Inflows minus Outflows). |
| Closing Cash Balance | The resulting liquid position at the end of the period (Opening Balance plus Net Cash Flow). |
| Minimum Cash Threshold | A pre-defined internal safety buffer representing the absolute minimum liquid reserve required to maintain healthy operations. |
Actuals vs. Projections
A high-performing cash flow forecast spreadsheet must incorporate a mechanism to distinguish historical actual figures from forward-looking estimates. As each week or month closes, replacing estimated figures with hard bank-feed actuals enables variance analysis, helping you spot structural forecasting errors and iteratively refine the accuracy of your future projections.
How to Create a Cash Flow Forecast Spreadsheet in Excel
Building a functional cash flow forecast spreadsheet does not require complex financial modeling software; standard spreadsheet applications like Microsoft Excel or Google Sheets provide all the necessary grid logic and mathematical functions.
The step-by-step framework below outlines a standard three-month forecast model. However, you can easily scale the architecture horizontally to cover a 6- or 12-month annual budget, or switch column intervals to weekly tracking when managing high-frequency liquidity cycles.
Step 1: Set Up the Spreadsheet Grid
Open Microsoft Excel or Google Sheets and create a blank workbook to establish the core layout of your cash flow forecast spreadsheet.
Column Structure
Set up your horizontal columns across row 1 to handle a rolling three-month horizon:
- Column A: Cash flow item (Line Item Labels)
- Column B: Month 1
- Column C: Month 2
- Column D: Month 3
Row Line Items
In Column A, enter the following 14 standardized financial categories down your rows:
- Opening cash balance
- Customer receipts
- Other cash inflows
- Total cash inflows
- Payroll
- Supplier payments
- Operating expenses
- Taxes and debt repayments
- Other cash outflows
- Total cash outflows
- Net cash flow
- Closing cash balance
- Minimum cash threshold
- Cash warning
This clean, linear structure provides an intuitive baseline for your cash flow forecast spreadsheet, allowing you to add extra monthly columns or granular weekly iterations as your business scales.
Step 2: Enter the Opening Cash Balance
The opening cash balance serves as the foundational liquidity baseline for your cash flow forecast spreadsheet, representing the total cash available at the absolute beginning of the forecast period.
Depending on your company’s operational stage, determine this figure as follows:
- For Existing Businesses: Pull a fully reconciled cash balance directly from your verified bank statements or financial accounting records.
- For Startups: Input the actual liquid cash currently sitting in your business bank accounts from initial founder equity, seed funding, or verified cash injections.
Crucial Rule
Never inflate your opening balance by factoring in anticipated future customer receipts or unapproved, pending financing rounds. Only include capital that is fully cleared and currently accessible in your accounts.
Step 3: Forecast Cash Inflows
Cash inflows within your cash flow forecast spreadsheet represent all monetary receipts expected to enter your business bank accounts during the period.
Common inflow categories include:
- Customer Invoice Collections: Payments cleared from accounts receivable based on agreed credit terms.
- Cash Sales: Immediate point-of-sale revenue collections.
- Subscription & Retainer Payments: Recurring automated billing revenue.
- Contract Milestones: Project-based phase completions and associated client disbursements.
- Other Operating Receipts: Secondary income streams, VAT/tax refunds, or interest earned.
The Golden Rule: Invoice Date vs. Collection Date
When populating your cash flow forecast spreadsheet, always record expected funds under the month they are actually expected to clear into your bank account, not the month the invoice was issued.
Example
If you issue a B2B invoice with 30-day terms in January, but your client historically pays in 45 days (mid-February), you must record that cash receipt in the Month 2 (February) column. Conflating invoice dates with actual cash realization is the primary cause of inaccurate liquidity forecasting.
Step 4: Forecast Cash Outflows
Cash outflows within your cash flow forecast spreadsheet capture all monetary disbursements leaving your accounts during the defined period. Group these liabilities logically to maintain clear visibility across both fixed and variable expenses:
- Payroll & Contractors: Gross salaries, hourly wages, payroll processing fees, and independent contractor retainers.
- Fixed Overheads: Commercial rent, utilities, insurance premiums, and recurring software or SaaS subscriptions.
- Inventory & Supplier Invoices: Cost of goods sold (COGS), raw materials, and accounts payable settlements based on agreed vendor terms.
- Debt Service & Taxes: Principal and interest loan repayments, statutory tax remittances, and periodic government filings.
- Capital Expenditures (CapEx): One-off equipment purchases, hardware upgrades, or major asset acquisitions.
The Principle of Actual Disbursement
Just like customer receipts, outflows must be recorded in the exact month they are scheduled to leave your bank account.
Example
f you commit to purchasing new production equipment in Month 1 but the invoice is net-60 and payable in Month 3, record the full cash outflow in the Month 3 column. Never artificially amortize lump-sum expenses across multiple months unless the cash is actually leaving your account in installments. Aligning outflows strictly with real bank clearance dates ensures your cash flow forecast spreadsheet remains a reliable operational shield against unexpected liquidity crunches.
Step 5: Calculate Total Cash Inflows
Aggregating your expected revenue streams gives you a clear top-line view of capital entering the business each period. In your cash flow forecast spreadsheet, Row 7 is designated to calculate Total Cash Inflows based on customer receipts and secondary income sources.
Applying the Formula
Assuming your line items are structured with Customer Receipts in Row 5 and Other Cash Inflows in Row 6:
- In cell B7 (Month 1), enter the following formula:
=SUM(B5:B6) - Drag or copy this formula across to the remaining monthly columns (e.g., cell C7 for Month 2, cell D7 for Month 3) to automatically compute total inflows across your entire forecasting horizon.
Utilizing standard Excel aggregation functions like SUM ensures your cash flow forecast spreadsheet dynamically updates whenever you adjust underlying customer collections or secondary revenue assumptions.
Step 6: Calculate Total Cash Outflows
Accurately aggregating your expenditures is vital for maintaining a reliable cash flow forecast spreadsheet. This step sums all projected operational disbursements to give you a clear, period-by-period view of your total capital burn.
Applying the Formula
Assuming your outflow categories occupy Rows 9 through 13 (covering payroll, supplier payments, operating expenses, tax/debt obligations, and miscellaneous outflows) and Row 14 is designated for Total Cash Outflows:
- In cell B14 (Month 1), enter the formula:
=SUM(B9:B13) - Copy or drag the formula horizontally across to the remaining monthly columns (e.g., Column C for Month 2, Column D for Month 3).
Using dynamic range formulas ensures that your cash flow forecast spreadsheet instantly recalculates total monthly burn whenever you adjust underlying expense assumptions or vendor terms.
Step 7: Calculate Net Cash Flow
Net cash flow measures the immediate monthly variance between capital entering and leaving your operations, serving as a core performance metric within your cash flow forecast spreadsheet.
Applying the Formula
Assuming Row 7 represents Total Cash Inflows and Row 14 represents Total Cash Outflows, use Row 15 to track Net Cash Flow:
- In cell B15 (Month 1), enter the formula:
=B7-B14 - Copy or drag the formula horizontally across the remaining monthly columns (e.g., Column C for Month 2, Column D for Month 3).
Interpreting the Result
- Positive Net Cash Flow: Indicates that expected cash receipts exceed disbursements during the month, growing your liquid reserves.
- Negative Net Cash Flow: Indicates that operating payments exceed incoming revenue for that specific period.
Contextual Note
A negative net cash flow month is not automatically a sign of distress if your company maintains healthy cash reserves from prior periods. Evaluating this metric alongside your closing balance and minimum safety thresholds is essential for determining true liquidity health in your cash flow forecast spreadsheet.
Step 8: Calculate the Closing Cash Balance
The closing cash balance represents the total liquid capital expected to remain in your accounts at the end of the month, accounting for all incoming receipts and outgoing disbursements.
Applying the Formulas
Assuming Row 4 contains your opening cash balance, Row 15 contains your net cash flow, and Row 16 is designated for the closing cash balance:
- For Month 1 (cell B16), enter the formula:
=B4+B15 - Establish the rolling linkage for Month 2 (cell C4):
=B16 - Establish the rolling linkage for Month 3 (cell D4):
=C16(and continue this pattern across any additional monthly columns).
This creates an automated, continuous financial model within your cash flow forecast spreadsheet, ensuring that each month’s closing cash balance instantly rolls over to become the opening liquidity baseline for the next cycle.
Step 9: Add a Minimum Cash Threshold and Warning System
Even with positive net cash flows, failing to maintain an adequate safety buffer can leave a business vulnerable to sudden billing spikes or unexpected operational delays. Establishing an automated warning system inside your cash flow forecast spreadsheet ensures you identify impending liquidity squeezes before they compromise your operations.
Determining Your Threshold
The appropriate minimum cash threshold depends on several key risk factors:
- Total monthly payroll commitments and statutory obligations.
- Supplier payment terms and accounts payable volatility.
- Historical revenue fluctuations and seasonality.
- Access to emergency credit lines or secondary financing.
Applying the Warning Formula
Assuming your minimum cash threshold is stored in a designated cell (such as B18), your projected closing balance sits in Row 16, and you want to use Row 19 to trigger alerts:
- In cell B19 (Month 1), enter the conditional formula:
=IF(B16<$B$18,"CASH WARNING","OK") - Copy or drag the formula across to the remaining monthly columns (e.g., Column C for Month 2, Column D for Month 3).
How It Works
Leveraging Excel’s logical IF function evaluates whether your projected closing balance drops below your safety limit. If the balance falls short, the cell dynamically displays “CASH WARNING”, giving management immediate visual cues to intervene—whereas safe periods cleanly display “OK”.
Step 10: Verify and Audit Your Cash Flow Forecast Spreadsheet
Before relying on your financial projections for operational decisions, rigorously audit your cash flow forecast spreadsheet. A spreadsheet can run mathematical formulas flawlessly yet still produce catastrophic forecasting errors if the underlying mechanics or assumptions are flawed.
Verify the following audit checklist across your model:
- Rolling Balance Continuity: Confirm that each month’s opening balance explicitly links back to the exact cell of the preceding month’s closing balance.
- Temporal Accuracy: Double-check that customer receipts and expense outflows are mapped strictly to their real-world bank clearance dates rather than invoice issue dates.
- Conditional Logic Integrity: Verify that your warning formula references the correct closing balance row and dynamically updates when thresholds are crossed.
- Absolute Cell Referencing: Ensure your minimum cash threshold cell uses absolute anchoring (e.g.,
$B$18) so the reference does not shift or break when the formula is copied horizontally. - Formula Integrity: Scan all range aggregations to guarantee that no manual entries have accidentally overwritten active
SUMorIFformulas.
Final Reality Check
Remember that a cash flow forecast spreadsheet is only as accurate as your underlying assumptions. Regularly compare your projections against historical bank statements to refine your collection timelines and expense estimates over time.
Cash Flow Forecast Spreadsheet Example
To ground these principles in practice, the following hypothetical model illustrates how a small consulting business maps its liquid position over a three-quarter forecasting horizon using a cash flow forecast spreadsheet.
| Cash Flow Item | Month 1 | Month 2 | Month 3 |
| Opening cash | $20,000 | $25,000 | $27,000 |
| Cash inflows | $15,000 | $18,000 | $20,000 |
| Cash outflows | $10,000 | $16,000 | $22,000 |
| Net cash flow | $5,000 | $2,000 | -$2,000 |
| Closing cash | $25,000 | $27,000 | $25,000 |
Note: Illustrative figures only. These numbers do not represent an actual business forecast.
Key Takeaways from the Example
- Growth and Contraction Cycles: The business expands its liquid reserves during Months 1 and 2 as customer receipts outpace operating disbursements.
- The Value of Dual Metrics: In Month 3, expected cash outflows exceed inflows by $2,000, resulting in a negative net cash flow. However, because the business maintains a healthy cumulative buffer, the projected closing cash balance remains robust at $25,000.
- Operational Insight: This scenario highlights why reviewing both net cash flow and closing balances in a cash flow forecast spreadsheet is vital—a single negative monthly delta does not automatically mean a business is unable to meet its upcoming financial obligations.
How to Use a Cash Flow Forecast Spreadsheet for 30-, 60-, and 90-Day Planning
A well-architected cash flow forecast spreadsheet serves as both an operational dashboard and a strategic compass. By adjusting your projection windows, you can evaluate liquidity risk across distinct time horizons, turning raw numbers into actionable business intelligence.
| Forecast Horizon | Primary Operational Purpose | Core Strategic Questions to Consider |
| 30 Days | Immediate Cash Management | Do we have sufficient liquid capital to clear upcoming payroll, rent, and imminent supplier invoices? |
| 60 Days | Short-Term Working Capital Planning | Are projected customer collections robust enough to cover upcoming operating expenses without dipping into reserves? |
| 90 Days | Forward-Looking Strategic Planning | Can the business safely absorb upcoming expansion costs, such as new hires, equipment purchases, or increased marketing spend? |
Tailoring Horizons to Operational Volatility
While standard 30-, 60-, and 90-day monthly horizons suit most established businesses, operational realities dictate your required granularity:
- The High-Volatility Rule: If your business operates on tight cash reserves or experiences severe receivable delays, transition your cash flow forecast spreadsheet from monthly columns to weekly tracking intervals.
- Granular Visibility: Weekly views expose intra-month pinch points—such as payroll obligations falling due five days before a major client invoice clears—that macro monthly summaries completely mask.
Strategic Reminder
These planning windows are probabilistic forecasting models, not guarantees. Use them as early-warning systems to dynamically adjust your burn rate as market conditions shift.
How to Calculate Cash Runway in a Spreadsheet
Cash runway estimates how long a business can continue operating before exhausting its available cash reserves. When managing a financial model, calculating runway provides a macro-level metric for business survival and capital efficiency.
The Simplified Runway Formula
For a business with a relatively stable monthly cash burn, the calculation uses a straightforward equation:
$$\text{Cash runway} = \text{Available cash} \div \text{Average monthly net cash burn}$$
- Example Calculation: Assume a startup has $60,000 in available cash and an average monthly net cash burn of $10,000.
$$\$60,000 \div \$10,000 = 6 \text{ months}$$
Limitations of a Single Runway Calculation
While helpful for a quick overview, this formula relies heavily on macroeconomic assumptions:
- It assumes monthly cash burn remains relatively stable.
- If customer receipts, seasonal expenses, or financing terms change significantly, a static runway calculation quickly becomes inaccurate.
Integrating with Your Cash Flow Forecast Spreadsheet
For businesses with irregular cash movements or lump-sum capital expenditures, relying on a period-by-period cash flow forecast spreadsheet is far more informative than a single static runway calculation. By utilizing a dynamic model, you account for exact cash clearance dates and avoid the blind spots of blended averages.
How to Use Scenario Analysis in Your Cash Flow Forecast Spreadsheet
Static projections leave businesses vulnerable to sudden market volatility or operational missteps. Scenario analysis allows management to stress-test financial assumptions within a cash flow forecast spreadsheet, evaluating how potential shocks or strategic decisions impact future liquidity before committing capital.
To build a robust predictive model, founders typically evaluate three distinct operational scenarios:
| Scenario Type | Core Assumption Framework | Strategic Objective |
| Base Case | Expected customer collections, normal seasonal sales, and standard vendor payment terms. | Establish a realistic baseline for day-to-day operations. |
| Optimistic Case | Accelerated accounts receivable collections, higher sales volume, or expanded margins. | Identify capacity for aggressive growth, hiring, or capital investment. |
| Conservative Case | Delayed client payments, lower sales conversion, or unexpected expense spikes. | Determine whether cash reserves can absorb shocks without risking insolvency. |
Stress-Testing Specific Variables
A major advantage of maintaining a dynamic cash flow forecast spreadsheet is the ability to isolate and manipulate individual variables to observe cascading effects:
- Delayed Collections: If key clients historically push payment terms from 30 to 60 days, model this shock by shifting expected customer receipts into the following month’s column. This immediately reveals whether the resulting cash gap triggers a “CASH WARNING”.
- Major Capital Outlays: Test the liquidity impact of hiring new headcount, purchasing equipment, or increasing marketing expenditure before making binding contractual commitments.
- Cost Rationalization: Conversely, model the runway extension achieved by freezing non-essential software subscriptions or renegotiating supplier terms.
The ultimate objective of scenario analysis is moving from reactive crisis management to proactive financial architecture, ensuring your cash flow forecast spreadsheet acts as an early-warning defense system.
Common Mistakes to Avoid in Your Cash Flow Forecast Spreadsheet
Even with robust formulas, a cash flow forecast spreadsheet can produce dangerous blind spots if built on flawed assumptions or poorly maintained habits. Avoiding these six common pitfalls ensures your financial model remains a reliable operational compass:
- Confusing Revenue with Cash Receipts: Recording booked revenue or issued invoices as available cash is a fatal error. Accrual accounting recognizes revenue when earned, but your cash flow forecast spreadsheet must track liquid funds only when they clear into your bank account based on expected payment dates.
- Ignoring Delayed Client Payments: Assuming every customer will pay precisely on net-30 terms ignores real-world friction. Always build a conservative buffer or scenario alternative for clients who habitually stretch payment terms, preventing unexpected cash crunches.
- Forgetting Irregular or One-Off Expenses: Failing to account for lump-sum outflows—such as annual software licensing, quarterly tax installments, or major equipment purchases—distorts your monthly burn rate. Map these known commitments strictly to their anticipated month of bank clearance.
- Treating Projections as Guaranteed Certainties: A forecast is a probabilistic planning model, not an audited guarantee. Market volatility, shifting sales volumes, and unforeseen operational disruptions mean your actuals will diverge from projections.
- Failing to Establish an Update Routine: A cash flow forecast spreadsheet quickly loses value when left static. Establishing a weekly or monthly review habit to overwrite estimates with actual bank feed data is essential for maintaining model accuracy.
- Overcomplicating the Architecture: Building an overly complex model with dozens of unnecessary line items, nested macros, and unverified assumptions makes the spreadsheet fragile and difficult to maintain. Start with a clean, streamlined framework and add complexity only when it directly improves decision-making.
Cash Flow Forecast Spreadsheet vs. Cash Flow Statement
While both documents deal with business liquidity, a cash flow forecast spreadsheet and a traditional cash flow statement serve entirely different operational purposes. Conflating the two can lead to severe planning errors; understanding their distinctions is critical for robust financial governance.
| Feature | Cash Flow Forecast Spreadsheet | Cash Flow Statement |
| Primary Purpose | Estimate future cash movements and identify upcoming liquidity gaps. | Report historical cash movements over a completed accounting period. |
| Time Horizon | Forward-looking (weekly, monthly, quarterly, or annual projections). | Backward-looking (completed historical quarters or fiscal years). |
| Main Organizational Use | Operational planning, runway monitoring, and strategic decision-making. | Financial reporting, tax compliance, and external stakeholder analysis. |
| Underlying Inputs | Projections, expected transaction dates, and operational assumptions. | Verified, recorded historical financial transactions and bank feeds. |
| Definitive Output | Projected cash balances and early-warning alerts. | Actual audited cash movements across operating, investing, and financing activities. |
The Feedback Loop: Bridging History and Projections
The core distinction lies in temporal orientation: a forecast anticipates what may happen, whereas a cash flow statement documents what has already happened.
However, these tools are deeply interdependent. Founders and finance managers should regularly feed historical data from past cash flow statements back into their cash flow forecast spreadsheet. Analyzing past collection delays, seasonal expense spikes, and actual burn rates provides the empirical baseline needed to sharpen future projections and eliminate costly forecasting blind spots.
What is the purpose of a cash flow forecast spreadsheet?
Its core purpose is to estimate future cash receipts, disbursements, and balances so a business can anticipate liquidity crunches, calibrate expenses, monitor runway, and make informed financial decisions.
Can I create a cash flow forecast spreadsheet in Excel?
Yes. Microsoft Excel (or Google Sheets) can be used to build a robust model using standard formulas such as SUM and IF. A foundational setup requires tracking opening cash, expected inflows, expected outflows, net cash flow, and closing cash balances.
How far ahead should a business forecast cash flow?
The appropriate time horizon depends on your operational model and volatility:
Short-term operational management typically covers 30 to 90 days or a 13-week rolling window.
Strategic planning and annual budgets often cover 6 to 12 months.
Businesses seeking external funding or SBA loans may need multi-year financial projections as part of their formal business plan.
How often should I update my cash flow forecast spreadsheet?
A weekly or monthly update cycle is a practical industry standard. Businesses with volatile receivables, tight liquidity reserves, or rapid operational changes benefit significantly from more frequent, weekly reviews.
Can a cash flow forecast predict business failure?
No. A cash flow forecast spreadsheet is a probabilistic planning model rather than a crystal ball. While it can successfully identify potential cash shortages and liquidity gaps under your modeled assumptions—giving management time to intervene—it cannot automatically account for every unpredictable external market shock or operational disruption.
Is a cash flow forecast the same as a cash budget?
The terms are frequently used interchangeably, but subtle operational differences exist:
A cash budget typically establishes a target plan or spending limit for expected receipts and payments over a future period.
A cash flow forecast spreadsheet estimates dynamic future cash movements and rolling liquid balances based on actual clearance timing.
Ultimately, the distinction depends on how your business defines and utilizes its internal financial planning documentation.
In Conclusion
Mastering your company’s liquidity does not require complex enterprise software; it requires financial discipline, accurate timing assumptions, and a well-structured cash flow forecast spreadsheet. By systematically mapping expected monetary movements against real-world bank clearance dates, you transform abstract accounting metrics into actionable operational intelligence.
Core Principles to Remember
- Establish a Clean Baseline: Begin with a fully reconciled opening cash balance derived exclusively from cleared, accessible funds.
- Map Real Clearance Dates: Record customer receipts and expense outflows in the exact period cash actually moves, avoiding the distortions of accrual accounting.
- Automate Core Logic: Leverage standard spreadsheet formulas (
SUM,IF) to dynamically calculate net cash flows, rolling closing balances, and early-warning safety thresholds. - Stress-Test Operations: Use scenario analysis to evaluate how delayed collections, one-off capital expenditures, or market shocks impact your runway.
- Maintain a Regular Cadence: Update your cash flow forecast spreadsheet weekly or monthly, replacing estimates with actual bank feed data to drive continuous model accuracy.
Your Immediate Next Step
Open Excel or Google Sheets, build out your 14-line foundational grid structure, input your current reconciled cash balance, and map out your projected receipts and disbursements across the next 30 to 90 days.
Professional Note: For major structural financing, complex tax planning, or significant capital investment decisions, always review your finalized cash flow forecast spreadsheet with a qualified accountant or financial professional.