Data Analyst Career Guide Without a Computer Science Degree
Yes, you can land a job in tech without a Computer Science background. This Data Analyst Career Guide shows you how to transition into analytics by focusing on what employers actually care about: cleaning data, answering business questions, mastering SQL and Excel, building clear dashboards, and communicating insights.
While a technical degree may appear on job descriptions, a strong portfolio, practical skills, and proof of work can make you a competitive candidate—especially for entry-level, business intelligence, marketing, and operations roles.

Designed for career changers, non-technical graduates, and self-taught learners, this guide covers what analysts actually do, which skills to prioritize first, how to build real-world experience, and how to position yourself for hiring.
What Does a Data Analyst Do?
A data analyst turns raw, unstructured information into actionable insights that drive business decisions. As detailed throughout this data analyst career guide, the core workflow involves defining a business problem, collecting relevant datasets, cleaning errors, discovering patterns, building interactive dashboards, and communicating findings to decision-makers.
Core Responsibilities
- Data Integration: Combining datasets from spreadsheets, SQL databases, customer surveys, or internal business systems.
- Data Cleaning & Preparation: Resolving duplicate records, missing values, inconsistent formatting, and incorrect data types.
- Querying & Analysis: Writing SQL queries to filter, join, aggregate, and analyze trends.
- Business Metric Tracking: Calculating key performance indicators (KPIs) like conversion rates, average order value (AOV), retention rates, or churn.
- Data Visualization: Building dynamic charts and executive dashboards using tools like Power BI, Tableau, or Excel.
- Stakeholder Communication: Translating technical findings, statistical assumptions, and business recommendations into plain language for non-technical teams.
- Process Automation: Replacing manual, error-prone spreadsheets with scheduled, repeatable reporting workflows.
Industry Insight
According to ONET data, closely related roles—like Business Intelligence Analysts—focus heavily on financial and operational reporting. While many employers list a four-year degree as a preference, ONET notes that formal degree requirements vary significantly by role and company. Treat a computer science degree as job-specific rather than a strict industry baseline.
Data Analyst vs. Data Scientist vs. Data Engineer
Although these roles often work together, their responsibilities differ. Data analysts uncover insights for business decisions, data scientists build predictive models, and data engineers create and maintain the systems that collect and process data.
| Feature | Data Analyst | Data Scientist | Data Engineer |
| Primary Goal | Explaining what happened, why it happened, and what actions to take next (Descriptive & Diagnostic). | Predicting future outcomes and optimizing decisions using advanced statistical models (Predictive & Prescriptive). | Building, testing, and maintaining scalable data infrastructure, pipelines, and storage architectures (Infrastructure). |
| Core Skillset | Data cleaning, SQL querying, dashboarding, KPI calculation, business domain knowledge. | Advanced mathematics, statistics, machine learning, algorithm design, experimental design (A/B testing). | Data warehousing, ETL pipeline design, database architecture, distributed computing, cloud computing. |
| Primary Tools | SQL, Excel, Power BI, Tableau, Python (Pandas/NumPy) or R. | Python (Scikit-Learn, TensorFlow/PyTorch), R, SQL, Jupyter Notebooks, Spark. | SQL, Python/Scala, Airflow, Snowflake, AWS/GCP, Docker, Hadoop, Spark. |
| Math & CS Rigor | Moderate: Basic statistics, algebra, and logical reasoning. | High: Linear algebra, multivariable calculus, probability, and advanced statistics. | High (CS Emphasis): Computer science fundamentals, data structures, systems architecture, and software design. |
| Barrier to Entry | Lowest: High potential for non-technical background entry; heavy reliance on practical portfolio projects over formal degrees. | High: Often prefers or requires advanced degrees (Master’s/Ph.D.) in quantitative fields. | Moderate to High: Strongly favors software engineering principles or computer science/engineering fundamentals. |
Is a Computer Science Degree Required to Become a Data Analyst?
No—a computer science degree is not required for every data analyst position. However, “no Computer Science degree needed” does not mean “no preparation required.”
When navigating this transition, the critical distinction is between academic credentials and job-ready evidence. A formal Computer Science degree offers structured coursework in programming, databases, and mathematics.
Without one, you must demonstrate those same core capabilities through alternative proof of work: certifications, workplace projects, freelance assignments, open-source contributions, or a well-documented portfolio.
Credential (CS Degree)  ──>  Signals baseline technical ability
Portfolio (Proof of Work) ──>  Demonstrates immediate business value
Reality Check: What Employers Look For
Degree requirements vary significantly by employer, region, seniority, and industry:
- Traditional Enterprise & Corporate Roles: May use a general bachelor’s degree as an automated HR screening tool.
- Tech Startups, Agencies, & Modern Teams: Prioritize practical skills, tool proficiency, and real-world problem-solving over formal majors.
- Adjacent Industry Roles: Prioritize business domain experience over pure coding ability.
Data Insight: While government sources like the U.S. Bureau of Labor Statistics note that bachelor’s degrees are typical entry-level requirements for data-adjacent occupations, these broad categories do not represent a universal rule for every role titled “data analyst.”
Your 5-Step Execution Plan
If you do not have a computer science degree, ground your preparation in these five practical priorities covered throughout this data analyst career guide:
- Master the Core Stack: Focus heavily on SQL, Excel, and a primary visualization tool (Power BI or Tableau).
- Learn Applied Statistics: Master enough practical statistics to identify trends accurately without drawing misleading conclusions.
- Solve Realistic Business Problems: Build portfolio projects that solve concrete scenarios rather than using generic, overused datasets.
- Communicate Clearly: Practice explaining technical findings to non-technical stakeholders in simple terms.
- Leverage Existing Domain Expertise: Apply for roles in industries where you already have functional background knowledge.
The Non-Computer Science Advantage: Domain Knowledge
Coming from a non-technical background—such as finance, sales, healthcare, logistics, marketing, or customer operations—is a distinct competitive advantage. Technical skills teach you how to query data, but domain knowledge teaches you which questions matter and which metrics drive business impact.
Core Skills to Learn First
You do not need to learn every programming language or analytics platform at once. The core framework of this data analyst career guide emphasizes building a lean, focused stack through practical application before expanding into advanced tooling.
The 80/20 Skills Matrix
| Skill Area | Core Concepts to Learn | Portfolio Proof of Work |
| Excel / Google Sheets | Formulas, filters, pivot tables, XLOOKUP, data cleaning, conditional logic | Cleaned workbook & executive summary report |
| SQL | SELECT, WHERE, GROUP BY, JOINs, CTEs, window functions | Executable queries solving specific business questions |
| Applied Statistics | Averages, percentiles, distributions, sampling bias, correlation, confidence intervals | Short analysis explaining data uncertainty and baseline context |
| Data Visualization | Chart selection, visual hierarchy, filtering, layout, storytelling, accessibility | Dynamic Power BI/Tableau dashboard with written insights |
| Business Thinking | Metrics, KPIs, trends, segmentation, trade-offs | A clear problem statement linked directly to a strategic decision |
| Communication | Presenting findings, documenting assumptions, explaining limitations | Concise executive summary or presentation deck |
| Python or R (Optional) | Data manipulation (pandas), reusable analysis, automation | Documented Jupyter notebook reproducing an end-to-end analysis |
Spreadsheets (Excel / Google Sheets)
Excel is the most practical starting point because it forces you to interact with data directly. Focus on mastering:
- Sorting and filtering without altering underlying source records.
- Removing duplicates, standardizing inconsistent categories, and handling missing values.
- Writing modular formulas using
SUMIFS,COUNTIFS,XLOOKUP, and logical operators. - Building dynamic pivot tables and clear summary charts.
- Auditing calculated fields and verifying totals against source data.
Industry Note: Do not dismiss Excel as basic. Spreadsheets remain the backbone of operational planning, budgeting, and ad-hoc reporting across most organizations.
SQL (Structured Query Language)
SQL is the single most critical technical skill for non-degree candidates because it proves you can extract and manipulate raw data at the database level. Master syntax in this sequential order:
- Extraction: Query specific columns using
SELECTand filter rows usingWHERE. - Aggregation: Summarize metrics using
COUNT,SUM, andAVGpaired withGROUP BY. - Combination: Merge relational tables using
INNER JOINandLEFT JOIN. - Structure: Modularize complex queries using Subqueries and Common Table Expressions (CTEs).
- Advanced Analytics: Calculate running totals, ranks, and moving averages using Window Functions (
ROW_NUMBER,RANK,OVER).
Tip: For every query you write, frame the business question first (e.g., “Which customer segment had the highest repeat purchase rate last quarter?”) before writing code.
Applied Statistics
Junior analyst roles require practical statistical intuition rather than complex calculus. Focus on these core analytical concepts:
- Central Tendency & Spread: Mean, median, mode, range, variance, and standard deviation.
- Contextual Metrics: Ratios, percentage growth versus percentage-point changes.
- Analytical Pitfalls: Selection bias, skewed distributions, outliers, and confusing correlation with causation.
- Significance: Sample sizes, population boundaries, and introductory confidence intervals.
Common Pitfall: Stating that sales “increased by 20%” without providing the timeframe, baseline volume, sample size, or business context renders the metric meaningless.
Visualization & Business Intelligence (BI)
Select one primary BI platform initially (Power BI or Tableau) based on regional job demand.
Microsoft’s official Power BI Data Analyst curriculum organizes competency around four key pillars: preparing data, modeling data, visualizing and analyzing insights, and securing content. This provides an industry-standard blueprint for learning any visualization tool.
Best Practices for Dashboard Design:
- Select Intentional Visuals: Choose chart types that directly answer the core business question.
- Maintain Visual Hygiene: Eliminate clutter, avoid misleading axis scales, and ensure strong color contrast for accessibility.
- Provide Context: Include inline notes explaining key assumptions, metric definitions, and actionable takeaways.
- Focus on Utility: A good dashboard drives a specific decision; it is not simply a collection of charts.
A Practical Learning Roadmap
A realistic roadmap for non-Computer Science candidates typically spans 3 to 6 months of consistent study. As emphasized throughout this data analyst career guide, your exact pace will depend on your background, weekly study hours, and specific target roles.
Phase 1: Market Research ──> Phase 2: Spreadsheets ──> Phase 3: SQL ──> Phase 4: Data Viz/BI ──> Phase 5: Python (Optional)
Phase 1: Market Research & Target Selection
Before writing code or building models, analyze 10–20 entry-level job descriptions in your target location and industry. Document recurring tools, required skills, and core responsibilities.
Realistic Non-Computer Science Entry Points:
- Junior Data Analyst / Reporting Analyst
- Operations or Marketing Analyst
- Business Intelligence (BI) Analyst
- Financial, Commercial, or Product Analyst
- Research / Monitoring and Evaluation (M&E) Assistant
Strategy: Do not attempt to learn every skill listed across job postings. Identify the top 2–3 overlapping requirements across your target roles and focus exclusively on those.
Phase 2: Spreadsheet & Analytical Foundations
Spend the first 3–4 weeks mastering data preparation, core functions, and descriptive statistics using manageable datasets.
Core Competencies to Achieve:
- Clean raw datasets and handle missing values.
- Master lookup functions (
XLOOKUP) and conditional aggregation (SUMIFS,COUNTIFS). - Build dynamic pivot tables to summarize key metrics.
Self-Assessment Checklist: Can you clearly answer:
- Which product lines generated the highest revenue this quarter?
- Which operational regions experienced the highest customer churn rate?
- How did month-over-month performance trend across key segments?
Phase 3: Relational Databases & SQL
Transition from spreadsheets to relational databases. SQL is the primary technical barrier to entry for junior analysts; focus on writing clean, accurate, and verifiable queries.
Core Goals:
- Query datasets, filter parameters, and aggregate measures.
- Join multiple relational tables without creating duplicate records.
- Validate query outputs against raw source data to ensure accuracy.
Phase 4: Business Intelligence & Visual Reporting
Select one primary BI platform (Power BI or Tableau). Recreate an analysis previously built in Excel or SQL to connect data extraction, transformation, visualization, and storytelling.
Focus Areas (Power BI Example):
- Importing data and establishing relational data models.
- Writing basic DAX calculations for custom metrics.
- Designing clear, accessible dashboard layouts focused on user decisions.
Note: Microsoft’s official Power BI learning paths offer a structured framework for mastering these concepts, but practical portfolio builds should always take precedence over passing certification exams.
Phase 5: Applied Python (When Business Needs Require It)
Python enables automated pipelines, advanced statistical analysis, and the handling of larger datasets. However, it should be prioritized only after mastering SQL and spreadsheets, unless your target job postings explicitly require it.
Target Skillset:
- Fundamentals: Variables, lists, dictionaries, functions, and control flow.
- Data Processing: Loading files, filtering, and manipulating data using
pandas. - Reproducibility: Writing clean, documented scripts or Jupyter Notebooks.
How to Build a Hiring-Ready Portfolio
As emphasized throughout this data analyst career guide, a compelling portfolio demonstrates how you think, solve problems, and communicate—not just how well you format charts. Three well-documented, business-focused projects carry significantly more weight with hiring managers than ten shallow dashboards.
The Anatomy of a High-Signal Project
Every portfolio piece should follow a clear analytical narrative structured around these core components:
- Business Question: What specific problem or strategic question are you answering?
- Data Context & Source: Where did the dataset come from, and how was it gathered?
- Data Cleaning & Auditing: What errors, null values, or formatting issues did you resolve?
- Analytical Method: Which tools (SQL, Excel, Python) and statistical methods did you apply?
- Core Insights: What trends, anomalies, or relationships emerged from the data?
- Actionable Recommendations: What specific business steps should decision-makers take?
- Limitations & Assumptions: What missing variables or analytical boundaries should stakeholders keep in mind?
- Visual Artifact & Code: Direct links to interactive dashboards (Power BI/Tableau) and fully documented, reproducible code (GitHub or SQL scripts).
High-Value Portfolio Project Ideas
Frame every project around a concrete business decision rather than a generic summary.
- Retail & E-commerce: Analyze product sales, return rates, and monthly revenue drivers to pinpoint underperforming categories requiring inventory re-allocation.
- Performance Marketing: Compare campaign spend, click-through rates, and conversion metrics to optimize customer acquisition costs (CAC).
- Supply Chain & Operations: Examine regional delivery latency and order cancellation patterns to identify supply chain bottlenecks.
- Public & Open Data: Analyze regional transport, housing, or economic datasets, explicitly calling out data collection limitations and methodology risks.
WEAK APPROACH:  "I built a dashboard using retail sales data."
STRONG APPROACH: "I analyzed 12 months of sales and return records to identify top margin-draining categories, recommending a $50K inventory reallocation."
Code language: JavaScript (javascript)
Data Privacy & Ethics Guardrail
Never publish confidential company files, personally identifiable information (PII), or datasets with restrictive licensing. Always anonymize, aggregate, or synthesize sensitive information, and include an explicit privacy note in your project documentation.
How to Gain Data Experience Without a Formal Job Title
You do not need to wait for a company to officially give you the title “Data Analyst” to start gaining relevant experience. As highlighted in this data analyst career guide, hiring managers care about practical execution, analytical reasoning, and proof of work over official job titles.
7 High-Leverage Ways to Build Hands-On Experience
- Optimize Your Current Role: Automate an existing spreadsheet, clean a messy internal dataset, or build a recurring operational dashboard (with manager approval).
- Help Small Businesses: Offer to organize, clean, or analyze sales and customer records for local businesses or family enterprises.
- Volunteer for Non-Profits: Partner with local charities or community organizations to clean donor data, track event metrics, or analyze program outcomes.
- Publish In-Depth Case Studies: Execute end-to-end analytical projects using public datasets and publish your full methodology, SQL code, and business recommendations publicly.
- Participate in Data Competitions: Join platforms like Kaggle or DrivenData for practice, ensuring you clearly label competition work in your portfolio.
- Contribute to Open Source: Assist open-source projects by improving documentation, cleaning raw datasets, or writing data transformation scripts.
- Take Guarded Freelance Projects: Accept freelance opportunities only when project scope, data rights, compensation, and non-disclosure terms are clear.
Framing Your Previous Background as Analytics Experience
If you have worked in customer service, sales, teaching, operations, administration, or marketing, you likely have non-titled analytics experience already.
PAST EXPERIENCE ──> Reframed using the 4-Part Analytics Framework ──> HIGH-SIGNAL RESUME IMPACT
Transform standard job tasks into analytical accomplishments using this four-part structure: Question $\rightarrow$ Data $\rightarrow$ Method $\rightarrow$ Result.
- Customer Service: Before: “Answered customer support tickets.” $\rightarrow$ After: “Tracked and analyzed 1,000+ support tickets using Excel to identify top product friction points, reducing resolution time by 15%.”
- Education / Teaching: Before: “Graded student tests.” $\rightarrow$ After: “Analyzed student attendance and assessment trends to identify learning gaps and adjust curriculum targeting.”
- Marketing / Sales: Before: “Managed social media accounts.” $\rightarrow$ After: “Monitored campaign conversion metrics across channels, identifying high-ROI customer segments.”
Golden Rule: Highlight analytical thinking within past roles without exaggerating your actual scope or outcomes.
Courses, Certificates, or Self-Study?
There is no single best route into data analytics. As emphasized throughout this data analyst career guide, your optimal path depends on your budget, learning style, time availability, and target roles.
| Learning Route | Core Strengths | Key Limitations |
| Self-Study | Low cost, flexible pacing, customized curriculum | Requires high self-discipline; lacks structured feedback |
| Online Certificate | Structured curriculum, affordable credential | Quality varies; credentials do not prove job readiness alone |
| Bootcamp | Cohort support, structured portfolio builds, career services | High financial cost; variable post-grad placement rates |
| University Program | Recognized degree, deep foundations, alumni network | Slower completion time; highest financial investment |
| Workplace Transition | Leverages domain expertise and internal networks | Requires negotiating new responsibilities with management |
How to Evaluate Paid Programs
Before investing in a bootcamp or certificate, audit the provider using these criteria:
- Syllabus Depth: Does it focus heavily on SQL, Excel, and dashboarding, or is it padded with surface-level introductory topics?
- Project Output: Will you build original portfolio projects using real-world data, or simply follow step-by-step code tutorials?
- Instructor Credentials: Are the courses taught by active industry practitioners?
- Fine Print: What are the refund policies, tool subscription costs, and career support terms?
Red Flag Warning: Be skeptical of programs promising “guaranteed placement” or unrealistic entry-level salaries within weeks.
The Reality of Certificates
An online certificate (such as Google or IBM Data Analyst credentials) helps structure your study plan and clear preliminary HR filters. However, a certificate does not replace a portfolio, practical SQL fluency, or the ability to communicate insights clearly.
Final Checklist: How to Land Your First Data Role Without a Computer Science Degree
To synthesize the core frameworks of this data analyst career guide, execute this sequence:
Learn Stack (SQL/Excel/BI) ──> Build 3 Projects ──> Publish Code/Dashboards ──> Target Domain Roles
- Master the Core Stack: Focus on SQL, spreadsheets, and one primary visualization tool (Power BI or Tableau).
- Build Three High-Signal Projects: Focus on solving business questions, documenting data cleaning, and providing actionable takeaways.
- Showcase Your Work Publicly: Publish interactive dashboards and executable code on GitHub or portfolio sites.
- Leverage Domain Knowledge: Target roles in industries where your previous career background provides an immediate advantage.
- Prepare for Technical Reviews: Practice live SQL query tests, data cleaning scenarios, and case study presentations.
For a quick summary of the key skills covered in the IBM Data Analyst credential, check out Top Tools You’ll Learn in the IBM Data Analyst Professional Certificate. The video above highlights how industry platforms structure hands-on tools like SQL, Excel, and Python for practical career prep.
Preparing for Applications and Interviews
Apply when you can complete an end-to-end analysis independently, not when you feel completely confident. As emphasized throughout this data analyst career guide, real-world application feedback will quickly highlight which specific skills require refinement.
Optimizing Your CV for Analyst Roles
When transitioning without a computer science background, structure your CV to prioritize immediate evidence of capability over formal credentials:
- Top-Fold Positioning: Place technical proficiencies (SQL, Excel, Power BI/Tableau) and portfolio project links near the top of page one.
- Focus on Business Outcomes: Frame experience around analytical decisions and measurable results rather than basic task completion.
- Quantify Impact Honestly: Use concrete, verified metrics whenever permitted (e.g., “Automated weekly inventory reporting, reducing manual processing time by 4 hours”).
- Highlight Transferable Domain Knowledge: Showcase industry context from past careers (e.g., retail, operations, marketing, education, finance) as a strategic advantage.
- Match Target Keywords: Tailor terminology directly to the job description to pass Applicant Tracking Systems (ATS).
The 4 Core Interview Categories
Interview processes for data roles typically evaluate four specific areas:
| Interview Category | What Interviewers Test | How to Prepare |
| SQL & Technical | Query logic, JOIN mechanics, aggregate functions, and debugging syntax errors. | Practice writing live queries on whiteboards or shared documents; explain join types clearly. |
| Applied Statistics | Interpreting averages, percentage shifts, sample bias, and correlation versus causation. | Practice explaining statistical concepts using real-world business scenarios without jargon. |
| Business Case Study | Problem-solving logic, KPI selection, and metric definition for ambiguous scenarios. | Define a clear framework: identify the core issue, select relevant metrics, and outline investigative steps. |
| Stakeholder Communication | Translating technical findings for non-technical leadership and cross-functional teams. | Practice summarizing complex analyses into 2–3 concise, non-technical executive takeaways. |
The Project Presentation Framework
When presenting portfolio projects during interviews, structure your narrative using this sequence:
$$\text{Problem} \longrightarrow \text{Data Source} \longrightarrow \text{Method} \longrightarrow \text{Key Finding} \longrightarrow \text{Limitations} \longrightarrow \text{Actionable Recommendation}$$
Tip: If you do not know the answer to a technical question during an interview, outline the steps and logic you would use to investigate it rather than guessing.
Common Mistakes to Avoid
Breaking into data analytics without a computer science degree requires strategic focus. As emphasized throughout this data analyst career guide, avoiding common missteps saves months of wasted effort.
Avoiding Tool Overload
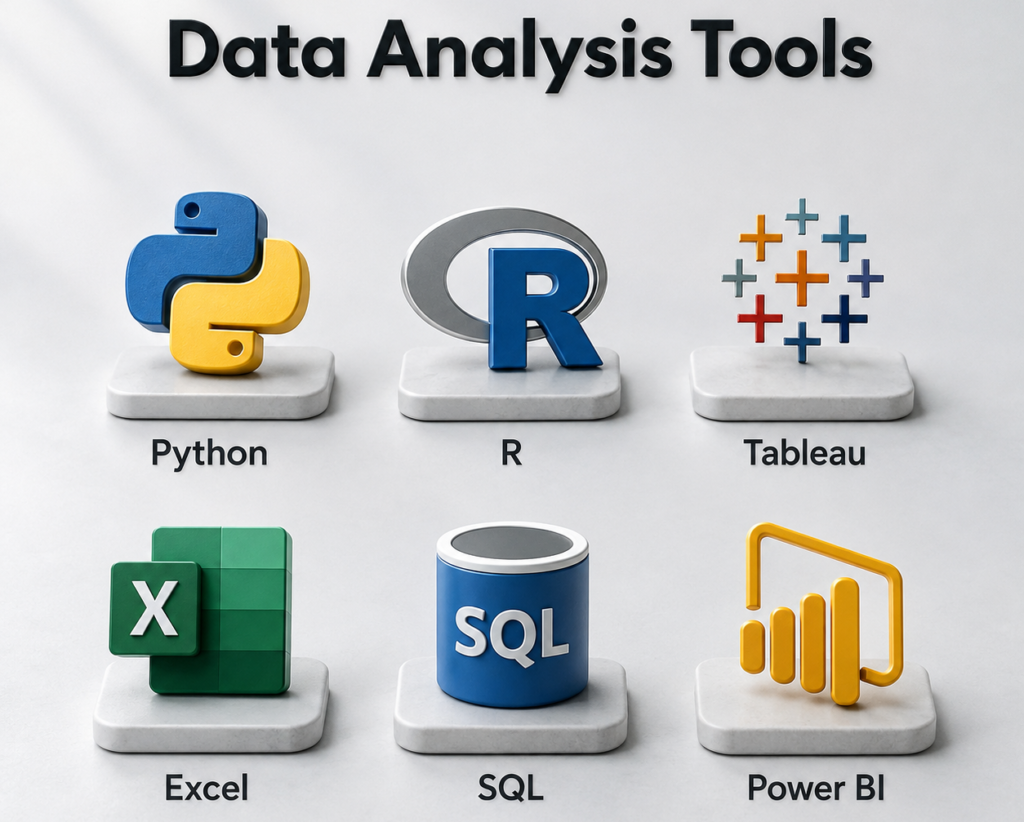
Attempting to master Python, R, Power BI, Tableau, SQL, and advanced Excel simultaneously leads to tutorial hell and surface-level knowledge. As emphasized throughout this data analyst career guide, hiring managers evaluate candidates on depth of problem-solving rather than tool count.
The 3-Tool Focus Stack Framework
To maximize hireability without burnt-out cycles, focus strictly on one tool per core operational layer before branching out:
[ Data Storage & Extraction ] ──> SQL
[ Data Transformation & Audit ] ──> Excel / Google Sheets
[ Dashboarding & Presentation ] ──> Power BI OR Tableau| Stack Layer | Recommended Tool | Mastery Threshold |
| 1. Data Extraction | SQL | Writing CTEs, window functions (RANK(), AVG() OVER()), and multi-table JOIN operations without syntax guides. |
| 2. Manipulation & Audit | Excel / Spreadsheets | Data cleansing, conditional aggregation (SUMIFS), lookup formulas (XLOOKUP), and dynamic pivot tables. |
| 3. Business Intelligence | Power BI OR Tableau | Building relational data models, creating measures, and publishing interactive dashboards focused on a clear business decision. |
Why “Tool Depth” Trumps “Tool Breadth”
- Deeper Portfolio Projects: A single project showcasing complex SQL logic paired with an interactive Power BI dashboard demonstrates job-readiness better than five shallow projects using different languages.
- Faster Interview Preparation: Technical assessments typically focus on live SQL querying and business logic rather than broad tool trivia.
- Higher Technical Retention: Deepening your understanding of relational database structures and metric design in one stack makes picking up secondary tools (like Python or R) vastly easier later in your career.
Avoiding Unfocused Dashboards
A visually stunning dashboard that doesn’t drive a business action is just an expensive art piece. One of the most common mistakes non-Computer Science candidates make in portfolio projects is filling a screen with every chart type available (pie charts, gauge meters, heatmaps) without framing the overarching business problem.
As highlighted throughout this data analyst career guide, effective business intelligence focuses on helping decision-makers take specific action based on clear data signals.
The Decision-Driven Dashboard Framework
Before opening Power BI, Tableau, or Excel, establish the decision framework for your visual report:
[ Core Business Problem ] ──> [ Key Supporting Metrics ] ──> [ Actionable Recommendation ]
Code language: CSS (css)| Element | Weak Dashboard Approach | Decision-Driven Approach |
| Project Focus | “Sales Overview Dashboard” | “Identifying Regional Product Returns to Reduce Operational Costs” |
| Primary Visual | Generic monthly revenue line chart | Return-rate breakdown by product category vs. historical baseline |
| User Interaction | Random filters with no clear path | Dynamic slicing by region, supplier, and fulfillment center |
| Outcome | “Revenue was $1.2M last quarter.” | “Product Category X has a 24% return rate due to sizing issues; recommend vendor audit.” |
How to Structure an Action-Oriented Portfolio Dashboard
- Lead with an Executive Callout: Place 3–4 high-level metric cards (KPIs) at the top left of the dashboard answering the primary business status (e.g., Total Revenue, Net Return Rate, Customer Acquisition Cost).
- Apply the 3-Second Rule: A stakeholder should understand the main takeaway within 3 seconds of looking at the primary chart. Avoid visual clutter, 3D charts, or unnecessary colors.
- Include Inline Annotations: Write brief text summaries or callout boxes directly inside the dashboard explaining why a metric shifted and what action management should evaluate next.
Avoiding Flawed Analytical Reasoning
Reporting that two variables move together is easy; proving that one causes the other is a completely different challenge. A major red flag for hiring managers reviewing non-Computer Science candidates is flawed analytical reasoning—specifically confusing statistical correlation with causation or presenting conclusions without acknowledging data limitations.
As emphasized throughout this data analyst career guide, strong technical skills in SQL or Python mean very little if your underlying logical reasoning leads business leaders toward costly, incorrect decisions.
Correlation vs. Causation: The Business Impact
- Correlation: A statistical measure indicating that two variables tend to fluctuate together.
- Causation: A proven relationship where a change in one variable directly causes a change in another.
[ Variable A Rises ] ──(+) Correlation──> [ Variable B Rises ]  (May be driven by Confounding Variable C)
[ Variable A Rises ] ──Direct Causation──> [ Variable B Rises ]  (Requires controlled testing or domain validation)
Code language: CSS (css)
Real-World Business Example:
Imagine an e-commerce platform notices that customers who download their mobile app spend 40% more annually than customers who only use the website.
- The Flawed Conclusion: “The app causes higher spending! We should allocate 80% of our marketing budget to drive app downloads.”
- The Analytical Reality (Confounding Variable): Customers who download the app are already highly loyal power users. The app didn’t cause them to spend more; their existing loyalty drove both the app download and their high spend. Allocating the entire budget to force downloads among casual buyers won’t automatically turn them into power users.
4 Statistical Pitfalls Every Analyst Must Avoid
| Pitfall | What It Means | How to Prevent It |
| 1. Confounding Variables | An unmeasured third factor driving both variables simultaneously. | Always ask: “What hidden variable could be influencing both metrics?” |
| 2. Selection Bias | Your sample dataset does not accurately represent the broader population. | Audit how data was collected; check if non-responders or inactive users were excluded. |
| 3. Small Sample Sizes | Drawing broad conclusions from too few data points. | Report sample size ($N$) alongside metrics and state when data is too thin for confidence. |
| 4. Ignoring Baseline Context | Reporting relative growth without showing absolute scale (e.g., “Sales jumped 100%!”). | Always state the baseline context (e.g., “Sales grew from 1 order to 2 orders” vs. “1,000 to 2,000”). |
How to Document Limitations Responsibly in Your Portfolio
A hallmark of a mature analyst is acknowledging what the data cannot tell you. Include a dedicated “Limitations & Assumptions” section in every portfolio write-up:
- State Missing Variables: “This analysis lacks customer demographic data, so we cannot isolate generational spending differences.”
- Highlight Time Boundaries: “Data reflects a 3-month holiday period and may not represent baseline annual behavior.”
- Propose Controlled Testing: “To prove causation, we recommend running a randomized A/B test on a 10% customer sample before a full rollout.”
Avoiding Skipped Data Hygiene
In real-world business environments, data is rarely delivered neat, structured, or complete. A major flaw in many beginner portfolio projects is jumping directly into building charts while ignoring underlying data quality issues—or cleaning the dataset in secret without documenting the logic applied.
As emphasized throughout this data analyst career guide, over 60% to 80% of an analyst’s daily job involves data cleaning, auditing, and preparation. If your analytical pipeline relies on bad data, your business insights will be fundamentally flawed.
The Cost of Poor Data Hygiene in Business
[ Raw Dirty Data ] ──( Unverified Analysis )──> [ Misleading Insights ] ──> [ Costly Business Failure ]
Code language: CSS (css)
When you fail to audit and clean data, common errors creep into your final reporting:
- Duplicate Records: Inflates revenue, customer counts, and transaction volumes.
- Inconsistent Labels: Categorizes
US,U.S.,United States, andusaas four separate countries in pivot tables. - Incorrect Data Types: Stores numeric values as text, breaking calculations and aggregations.
- Null & Missing Values: Distorts averages and correlation models if left unhandled.
The Data Audit & Cleaning Checklist
Before conducting any statistical analysis or dashboard build, run every dataset through a systematic data audit:
| Audit Category | Common Data Flaw | Cleaning Action & Fix |
| Completeness | Missing values in critical fields (Customer_ID, Order_Date) | Filter out incomplete records or impute missing values using median/mode (and document the choice). |
| Uniqueness | Duplicate transaction IDs from system sync errors | Identify and remove duplicate rows using SQL DISTINCT or ROW_NUMBER() OVER(PARTITION BY...). |
| Consistency | Inconsistent categorical values (M, Male, male) | Standardize text fields using UPPER(), TRIM(), or mapping tables. |
| Validity | Invalid dates (e.g., 2026-02-30) or impossible quantities (negative age/price) | Filter out impossible values and set strict boundary validation rules. |
| Accuracy | Extreme outliers caused by data entry errors ($1,000,000 purchase on a $10 item) | Audit outliers using IQR or z-scores to decide whether to exclude or isolate them. |
How to Document Data Cleaning in Your Portfolio
Hiring managers want to see how you handle messy data. Never hide your data preparation steps. Always include a dedicated “Data Cleaning & Transformation Log” in your project write-up or GitHub repository:
- Document the Raw State: “The initial dataset contained 12,450 records, of which 412 rows lacked customer region tags.”
- Explain Your Logic: “Rows with missing region tags accounted for less than 3% of total revenue; these were isolated into an ‘Uncategorized’ bucket rather than deleted to preserve accurate revenue totals.”
- Provide Reproducible Code: Include the exact SQL queries, Excel formulas, or Python scripts used to clean, transform, and reshape the dataset.
Avoiding Data Privacy Violations
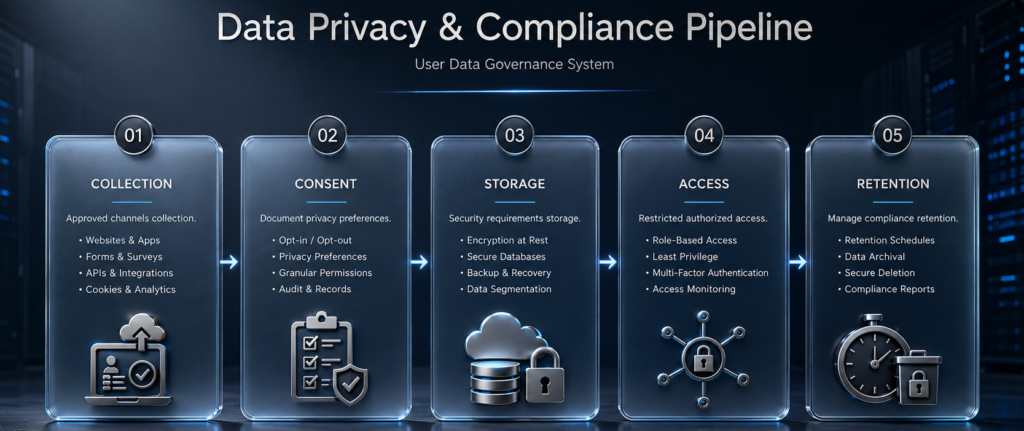
Nothing disqualifies a job applicant faster than displaying sensitive company records or real customer data in a public portfolio. Publishing Personally Identifiable Information (PII) or confidential employer metrics demonstrates a fundamental lack of professional ethics and risk awareness.
As detailed throughout this data analyst career guide, hiring managers evaluate how responsibly you handle data just as strictly as how well you write SQL queries.
What Counts as Sensitive Data?
Even if a dataset seems harmless to you, sharing any of the following fields publicly without explicit written consent is a major violation:
- Direct Identifiers (PII): Full names, email addresses, phone numbers, home addresses, social security numbers, or national identification numbers.
- Quasi-Identifiers: Combinations of zip codes, birth dates, job titles, or specific locations that could be linked back to an individual.
- Proprietary Business Data: Unreleased financial statements, internal profit margins, customer churn lists, or vendor pricing agreements.
4 Techniques for Safe Portfolio Publishing
Before uploading any portfolio project to GitHub, Tableau Public, or your personal website, apply these data anonymization practices:
| Technique | How It Works | Practical Example |
| 1. Masking & Hashing | Replacing identifiable fields with randomized IDs or surrogate keys. | Transform John Smith $\rightarrow$ Customer_10482. |
| 2. Aggregation | Grouping individual-level records into higher summary totals. | Convert specific daily purchases into monthly regional averages. |
| 3. Synthetic Data | Generating mock datasets that match real statistical distributions without using real records. | Use Python libraries like Faker to create artificial customer names and addresses. |
| 4. Feature Scaling | Multiply confidential financial figures by a constant factor to hide absolute numbers while preserving trends. | Scale all revenue metrics by $0.35\times$ to obscure actual dollar amounts while retaining percentage growth trends. |
Include a Privacy Statement in Your Documentation
Show hiring managers that you proactively prioritize compliance. Add a short “Data Ethics & Anonymization Note” to your portfolio repository:
“Data Governance Note: All customer names, contact details, and transaction IDs in this dataset have been fully anonymized using surrogate hashing keys. Financial metrics have been scaled to protect proprietary business values while preserving underlying analytical trends.”
Avoiding Data Privacy Violations
Publishing real-world company metrics or user data in a public portfolio can destroy your professional credibility faster than a poor technical interview. A major liability for non-Computer Science candidates is accidentally exposing Personally Identifiable Information (PII), proprietary business figures, or protected health/financial records in public GitHub repositories or Tableau Public dashboards.
As emphasized throughout this data analyst career guide, understanding data governance, confidentiality agreements, and compliance standards is just as critical as mastering SQL or dashboarding.
What Counts as Sensitive Data?
Never publish unmasked records containing any of the following fields:
| Category | Examples of Sensitive Fields | Potential Risk |
| Direct PII | Full names, email addresses, phone numbers, street addresses, national ID numbers | Identity theft, phishing, compliance violations (GDPR/CCPA) |
| Indirect PII | Specific birth dates, exact IP addresses, fine-grained GPS coordinates | Re-identification via cross-referencing public datasets |
| Proprietary Business Data | Internal profit margins, unannounced product lists, client lists, salary structures | Breach of NDA, commercial damage to former/current employers |
| Protected Domains | Patient diagnosis codes (HIPAA), credit card numbers (PCI-DSS), financial account details | Severe legal liability and regulatory fines |
The 4-Step Anonymization Framework for Portfolios
If you are using real-world operational data from a past employer, client, or freelance project for your portfolio, apply strict anonymization before publishing:
[ Raw Confidential Data ] ──> [ Anonymize & Mask ] ──> [ Aggregate Metrics ] ──> [ Public Portfolio ]
Code language: CSS (css)- Remove Direct Identifiers: Drop names, email addresses, and phone numbers entirely. Replace them with randomized, non-traceable keys (e.g., replace
John SmithwithCustomer_10492). - Aggregate Fine-Grained Values: Group individual transactions into broader summary categories. Convert specific birth dates into age brackets (e.g.,
25–34) and exact purchase amounts into relative percentage shifts or scaled indices. - Use Synthetic / Multiplied Scaling: Multiply proprietary revenue figures by a secret random factor (e.g., scaling all sales numbers by
0.47x). This preserves the underlying ratios, trends, and analytical insights without exposing real financial figures. - Leverage Public & Open Datasets: Whenever possible, build public portfolio projects using explicitly licensed open datasets from sources like Kaggle, Data.gov, Google Dataset Search, or UN Data.
How to Include a Privacy Statement in Your Portfolio
Demonstrate data maturity to hiring managers by adding an explicit Data Governance Note to your project documentation:
Data Privacy & Compliance Note:
“All customer records and financial metrics in this project have been fully anonymized and scaled to protect proprietary business data and comply with PII privacy standards. Individual identifiers have been hashed, and all transactional figures represent scaled relative values rather than actual operational revenue.”
Avoiding Credential Hoarding
Filling a LinkedIn profile with a dozen online course badges while having zero public code repositories or case studies is one of the fastest ways to get screened out by hiring managers. A major trap for self-taught candidates is credential hoarding—confusing the completion of structured tutorials with actual job readiness.
As emphasized throughout this data analyst career guide, certificates prove that you can follow step-by-step instructions. Only a portfolio proves that you can solve ambiguous, messy business problems independently.
The Illusion of Competence (Tutorial Hell)
Online courses are designed to guide you toward a guaranteed success state: clean datasets, pre-written syntax prompts, and multiple-choice quizzes. Real-world analytics work looks completely different:
TUTORIAL ENVIRONMENT  ──>  Clean Data + Guided Steps  ──>  Predictable Output (High Comfort)
REAL-WORLD JOB ROLE  ──>  Messy Data + Ambiguous Business Problem  ──>  Proof of Work (High Signal)
| Trait | Credential Hoarder | Portfolio-First Analyst |
| Primary Metric | 10+ certificates from Coursera/Udemy | 3 end-to-end, documented projects on GitHub/Tableau |
| Data Source Used | Pre-cleaned datasets provided by instructors | Raw public datasets, API scrapes, or messy real-world logs |
| SQL Capability | Copies queries from lecture slides | Writes complex CTEs and window functions from scratch |
| Problem Solving | Stuck when syntax produces an unexpected error | Audits data logic, checks join conditions, and debugs independently |
| Hiring Manager Signal | Low signal; signals high passive consumption | High signal; demonstrates immediate operational ROI |
The 1:1 Study-to-Build Rule
To escape tutorial hell, apply a strict 1:1 execution ratio: for every hour spent watching video lectures or completing course modules, spend at least one hour building, querying, or documenting your own independent project.
- Complete the Foundations (Max 1–2 Core Certificates): Pick one recognized foundational program (such as the Google Data Analytics or IBM Data Analyst certificate) to learn basic tooling and terms. Do not take 5 different “Intro to SQL” courses.
- Break the Tutorial Code: As soon as you complete a course exercise, immediately modify the parameters. Ask a different question of the same dataset, add new conditions, or pull in an external CSV to test your understanding.
- Build an Unguided Capstone: Pick a dataset from an industry you care about (e.g., healthcare, e-commerce, sports, or finance) and answer a business question without looking at step-by-step instructions.
How to Position Certificates on Your Resume
Certificates belong in a compact section near the bottom of your resume. They should validate your learning journey, not serve as your primary pitch:
Education & Credentials
- Professional Certificate in Data Analytics — Coursera / Google (2026)
- Key Focus: Relational database querying (SQL), spreadsheet modeling, and dashboard design in Tableau.(Note: Direct proof of execution and project code available at [GitHub Portfolio Link]).
Avoiding Title Myopia
Searching exclusively for job postings titled “Data Analyst” severely limits your opportunities. One of the most common strategic errors non-Computer Science job seekers make is Title Myopia—ignoring adjacent roles that use the same core skill stack (SQL, Excel, dashboarding, and problem-solving) under different operational job titles.
As emphasized throughout this data analyst career guide, modern companies structure their analytics talent across functional departments rather than locking all data responsibilities inside a single central team.
The Hidden Job Market: Adjacent Entry Points
Many department-specific analyst roles require the exact same core analytical abilities as a general data analyst, but often receive significantly fewer applicants because traditional tech applicants filter them out.
                  ┌──> Operations Analyst (Process Efficiency & Supply Chain)
                  ├──> Marketing / Growth Analyst (CAC, Conversion, Campaign ROI)
CORE DATA STACK   ├──> Reporting / BI Analyst (KPI Dashboards & Executive Summaries)
(SQL + Excel + BI)├──> Commercial / Sales Analyst (Pipeline Revenue & Churn Metrics)
                  └──> Customer Success Analyst (Retention, NPS, Support SLA Tracking)
| Adjacent Role Title | Primary Functional Focus | High-Leverage Domain Advantage |
| Operations Analyst | Logistics, supply chain bottlenecks, inventory turnover, and workflow efficiency. | Prior background in retail, hospitality, customer service, or management. |
| Marketing Analyst | Customer acquisition cost (CAC), conversion funnels, return on ad spend (ROAS), and email campaign metrics. | Background in copywriting, social media management, sales, or communications. |
| Reporting / BI Analyst | Building and maintaining scheduled executive dashboards, tracking recurring KPIs, and auditing data pipelines. | Strong proficiency in Power BI, Tableau, or Excel reporting. |
| Commercial / Sales Analyst | Sales pipeline velocity, deal conversion rates, pricing strategy, and quarterly revenue forecasting. | Prior background in B2B sales, account management, or administrative support. |
| People / HR Analyst | Employee retention rates, recruitment funnels, training effectiveness, and headcount planning. | Background in recruiting, office administration, or human resources. |
Why Adjacent Roles Are Easier Non-CS Entry Points
- Less Saturated Applicant Pools: Postings titled “Data Analyst” on major job boards often receive thousands of automated applications within 48 hours. Departmental roles receive fewer generic submissions.
- Domain Knowledge Outweighs Computer Science Credentials: A hiring manager for a Marketing Analyst position will frequently choose a candidate with strong domain marketing intuition and solid SQL over a Computer Science graduate who understands algorithms but doesn’t know what “cost per acquisition” means.
- Internal Mobility Engine: Landing an adjacent role gets your foot inside the door. Once inside an organization, transitioning into a core Data Analyst, Business Intelligence Analyst, or Analytics Engineer role is significantly easier.
Strategic Search Terms for Your Job Hunt
When searching job boards, replace the rigid query Data Analyst with these high-signal alternatives:
"Reporting Analyst""Business Operations Analyst""Marketing Operations Analyst""Commercial Analytics Specialist""Junior Business Intelligence Analyst""Data & Reporting Coordinator"
Avoiding Overstated Technical Depth
Claiming “Expert in SQL, Python, and Statistics” on a resume after finishing a 10-hour course is a trap that experienced technical interviewers instantly spot. One of the quickest ways to fail a technical screen as a non-Computer Science candidate is overstating technical depth—labeling basic tutorial familiarity as advanced professional mastery.
As emphasized throughout this data analyst career guide, hiring teams value honest, transparent self-assessments backed by demonstrable proof of work over exaggerated skill labels.
The Spectrum of Competence: Tutorial vs. Real-World Mastery
There is a vast execution gap between following a guided tutorial and writing production-ready queries under pressure:
[ Tutorial Syntax ] ──> [ Guided Execution ] ──> [ Independent Debugging ] ──> [ Production-Ready Mastery ]
Code language: CSS (css)| Skill Area | Tutorial-Level Competence (Beginner) | Practical Job-Ready Competence (Intermediate) | What Overstating Looks Like in Interviews |
| SQL | Writing basic SELECT ... WHERE queries on single tables. | Writing nested CTEs, window functions (RANK(), LAG()), and handling non-clustered indexes and join fan-outs. | Listing “Advanced SQL” on a resume, but failing to explain the difference between a LEFT JOIN and an INNER JOIN during a live code screen. |
| Python | Running provided Jupyter Notebooks and modifying variables in pandas scripts. | Handling missing data programmatically, writing custom functions, and optimizing memory allocation for large CSVs. | Listing “Python Expert,” but getting stuck when asked to write a simple for loop or clean an unformatted date column without step-by-step guidance. |
| Statistics | Calculating the mean, median, and mode on clean numeric columns. | Identifying selection bias, recognizing skewed distributions, and choosing the right statistical tests for business A/B experiments. | Stating “Statistical Modeling Mastery,” but asserting that a strong correlation proves direct operational causation. |
The Dangers of “Resume Inflation” in Technical Screens
- Immediate Loss of Trust: If a candidate claims “Advanced SQL” but struggles to explain a basic
GROUP BYaggregation, interviewers will question the authenticity of every other claim on their resume. - Aggressive Live Technical Testing: Labeling yourself an “Advanced” practitioner signals to technical interviewers that they should give you senior-level live coding problems (e.g., complex window functions, query optimization, dynamic partitioning).
- Mismatched Job Expectations: Getting hired under false technical pretenses leads to severe workplace friction, missed deadlines, and performance management issues during probation periods.
How to Frame Your Skill Depth Accurately
Reframe your resume skill section using transparent, proof-based terminology that sets realistic expectations while highlighting practical ability:
WEAK APPROACH:  "Advanced SQL, Python, and Statistical Modeling Expert"
STRONG APPROACH: "Proficient in SQL (CTEs, Joins, Aggregations) & Spreadsheets; Working Knowledge of Python (Pandas Data Prep)"
Code language: JavaScript (javascript)- Use Proficiency Levels Transparently: Categorize skills as Proficient (can use independently in daily work), Working Knowledge (can read and adapt existing code), or Familiar (understand concepts, currently building hands-on depth).
- Anchor Skills to Portfolio Code: Instead of self-rating your skills with arbitrary star scales (e.g., SQL: 5/5), link directly to executable queries or documented notebooks in your portfolio.
Avoiding Style Over Substance
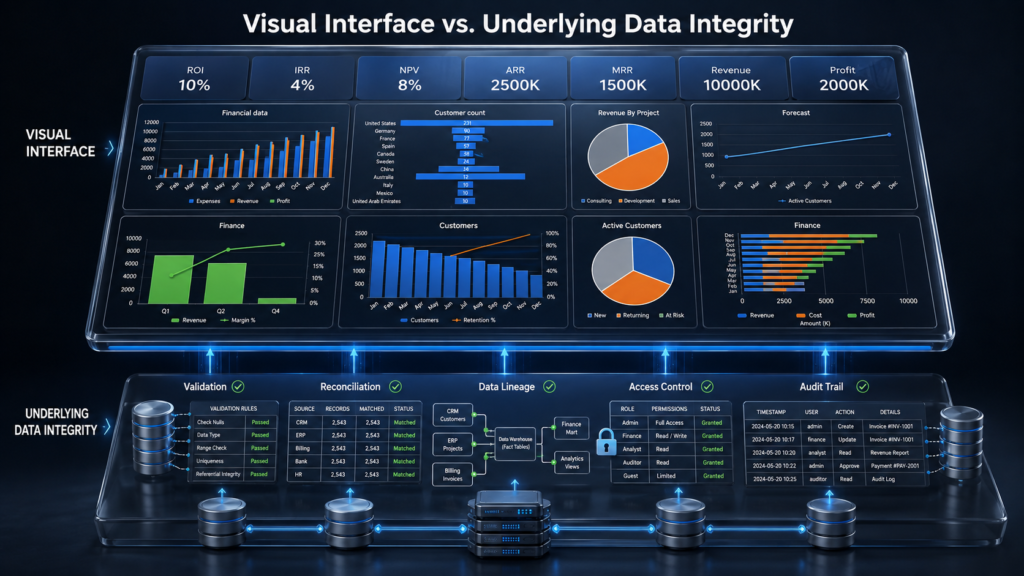
A sleek UI, custom dark-mode theme, and fluid animations cannot save a dashboard built on incorrect SQL logic or broken table relationships. A subtle trap for self-taught candidates is Style Over Substance—assuming that polished visual design validates the underlying data modeling and statistical accuracy.
As emphasized throughout this data analyst career guide, senior technical evaluators look past UI aesthetics to audit the integrity of the data pipeline, measure logic, and relationship schema underneath.
A sleek UI, custom dark-mode theme, and fluid animations cannot save a dashboard built on incorrect SQL logic or broken table relationships. A subtle trap for self-taught candidates is Style Over Substance—assuming that polished visual design validates the underlying data modeling and statistical accuracy.
As emphasized throughout this data analyst career guide, senior technical evaluators look past UI aesthetics to audit the integrity of the data pipeline, measure logic, and relationship schema underneath.
The “Iceberg Effect” of Data Visualization
In professional analytics, the visible dashboard layer is only the tip of the iceberg. The most critical technical work happens below the surface:
[ VISIBLE SURFACE ]  ──>  UI Layout, Charts, Color Palettes, & Filters (10% of Effort)
─────────────────────────────────────────────────────────────────────────────────────────
[ HIDDEN BACKEND ]   ──>  Data Modeling, Schema Design, DAX/SQL Measures, Integrity Checks (90% of Effort)
| Evaluated Layer | What “Style-First” Candidates Focus On | What Technical Interviewers Audit |
| Data Schema | Flat, unnormalized CSV files imported directly into Power BI or Tableau. | Star schema design (Fact vs. Dimension tables) and proper one-to-many relationship cardinality. |
| Calculations | Pre-calculated static spreadsheet columns that break when dynamic filters are applied. | Dynamic measures (e.g., explicit DAX measures or SQL CTE aggregations) that calculate metrics correctly across any slice. |
| Join Integrity | Unchecked multi-table joins that quietly duplicate revenue rows or drop unmatched records. | Audit checks for join fan-outs, missing foreign keys, and handling of null or unmapped values. |
| Metric Accuracy | Calculating averages of averages, truncating Y-axes, or using improper time-intelligence logic. | Context-aware metrics (e.g., Year-Over-Year growth calculated against proper calendar tables). |
Silent Errors That Polished UIs Hide
- The “Join Fan-Out” Trap: Joining a sales table to a promotions table on a non-unique key duplicates transaction rows. The dashboard looks clean, but total reported revenue is inflated by $200,000.
- Averages of Averages: Averaging regional conversion percentages directly instead of dividing total regional conversions by total regional visitors yields mathematically incorrect KPI cards.
- Implicit Measures: Dragging raw fields straight onto visual cards without writing explicit measures creates unpredictable behaviors when filtering across multiple dimensions.
How to Prove “Substance” in Your Portfolio
To demonstrate technical depth to hiring managers, accompany your visual dashboards with transparent backend documentation:
- Publish Your Data Model: Include a screenshot or diagram of your star schema showing how Fact and Dimension tables relate in Power BI/Tableau.
- Document Key Measures: List the exact SQL queries or DAX calculations used for core metrics alongside an explanation of how you validated them against raw source totals.
- Add an Audit Log: Include a short “Data Validation & Testing” section showing how you verified that row counts, total revenues, and distinct user IDs matched source database records before building visuals.
Avoiding Delayed Execution
Waiting until you feel 100% prepared before publishing your work or submitting your first job application is a form of procrastination disguised as preparation. A major obstacle for non-Computer Science candidates is Delayed Execution—spending months or years consuming courses in isolation while avoiding real-world feedback loops.
As emphasized throughout this data analyst career guide, momentum in a career transition comes from rapid iteration, shipping imperfect projects, and gathering direct feedback from peers, hiring managers, and technical screens.

The Perfectionism Trap vs. Fast Feedback Loops
Self-taught candidates often fall into the trap of believing they must master every tool before making their work public. In reality, the fastest skill acquisition happens after you expose your work to external review:
ISOLATED PREPARATION:  Study 12 Months ──> Zero Public Proof ──> Fear of Applying ──> Stagnation
ITERATIVE EXECUTION:   Study 6 Weeks   ──> Ship MVP Project ──> Gather Feedback  ──> Fast Iteration & Hiring
Code language: PHP (php)| Trait | The Delayed Execution Mindset | The Iterative Execution Mindset |
| Portfolio Goal | Waits to publish until a dashboard has 10+ complex features and perfect UI. | Publishes a clean Minimum Viable Product (MVP) analysis answering one clear business question. |
| Peer Feedback | Hides code until it feels “complete,” missing early corrections on SQL logic or modeling. | Shares work early on LinkedIn, GitHub, or analytics communities for constructive review. |
| Application Strategy | Refuses to apply until meeting 100% of a job posting’s listed qualifications. | Applies when able to solve a core business problem independently using SQL and Excel. |
| Market Signal | Learns skills in a vacuum based on assumptions of what employers want. | Uses actual interview technical screens and recruiter feedback to pinpoint real skill gaps. |
The 70% Readiness Rule
To break out of perfectionist paralysis, adopt the 70% Readiness Rule:
- Ship at 70% Confidence: When you can extract data using SQL, perform basic data cleaning, and build a structured chart that answers a business question, your project is ready to publish.
- Treat Applications as Market Research: Applying to entry-level and adjacent roles provides direct data on what hiring managers in your regional market actually value.
- Iterate in Public: Update your published portfolio projects over time. Adding a “Version 2.0” update to a GitHub repository based on community feedback demonstrates growth, adaptability, and continuous learning to recruiters.
3 Immediate Action Steps to Execute Today
- Publish Your First Repository: Take a spreadsheet or SQL script you completed recently, write a short 3-paragraph summary of the business problem and findings, and upload it to GitHub or LinkedIn today.
- Seek Direct Peer Review: Share your project link with an experienced analyst or in a tech community, asking one specific question: “Is my data cleaning logic sound, and is my core takeaway clear?”
- Submit 3 Applications This Week: Target entry-level, operations, reporting, or business intelligence roles to start testing your CV framing against live applicant tracking systems.
Can I become a data analyst without a university degree?
Yes, it is possible. While some traditional corporate employers use a four-year degree as an initial screening filter, industry data from sources like O*NET shows that formal degree requirements vary significantly by role, company size, and industry.
When you lack a university credential, your strongest competitive leverage comes from job-ready proof of work: a documented portfolio of real-world projects, demonstrated SQL/Excel proficiency in live technical assessments, and clear stakeholder communication skills.
Do I need to learn Python first?
No. Python is a powerful tool for automation and large-scale data manipulation, but it is rarely a strict requirement for entry-level analyst roles.
Start by building a solid foundation in Excel or Google Sheets, SQL, applied business statistics, and one primary visualization tool (Power BI or Tableau). Add Python later in your learning journey when you need to handle massive datasets, build repeatable pipelines, or automate recurring tasks.
How long does it take to become job-ready?
A focused self-taught learner can build a hiring-ready portfolio in roughly 4 to 9 months with consistent weekly study (10–15 hours per week).
Keep in mind that this is a practical estimate rather than a guarantee. Your exact timeline depends heavily on prior technical familiarity, weekly study hours, existing industry domain knowledge, local job market demand, and interview preparation.
Is a data analytics certification worth it?
It depends on how you use it. A recognized credential (such as the Google Data Analytics or IBM Data Analyst professional certificates) is valuable for structuring your learning roadmap, building foundational knowledge, and passing initial HR screening software.
However, a certificate does not guarantee employment on its own. Employers evaluate candidates on problem-solving ability and project outputs. Treat a certification as a structured foundation, then immediately apply those concepts to original, unguided portfolio projects.
What actionable steps should I take this week?
If you are ready to stop consuming tutorials and start taking action, execute this 3-step checklist this week:
Market Audit: Select 10–15 entry-level job postings in your target location/industry and note the top 3 recurring technical skills.
Build an MVP Analysis: Download a clean public dataset (e.g., from Kaggle or Data.gov) and execute a simple analysis in Excel or SQL.
Write an Executive Summary: Draft a concise 5-sentence summary outlining:
The business question
The core analytical finding
Data limitations
Your actionable recommendation
In Conclusion
A computer science degree is not a universal requirement to break into analytics—but proof of real-world capability is non-negotiable. As detailed throughout this data analyst career guide, your path to a high-leverage analytics role relies on replacing academic credentials with undeniable proof of work.
By mastering a lean 3-tool stack (SQL, Excel, and Power BI/Tableau), grounding your projects in clear business decisions, avoiding tutorial overload, and leveraging your unique domain expertise, you build a sustainable, scalable advantage in today’s job market.
[ Master 3-Tool Stack ] ──> [ Build 3 Decision-Driven Projects ] ──> [ Target Domain Roles ] ──> [ Land Job Offers ]
Code language: CSS (css)
Your Immediate Next Step
Select one specific entry-level role (e.g., Operations, Marketing, or Reporting Analyst), download an open dataset, and execute an end-to-end project that mirrors its daily responsibilities. Document every step from raw data cleaning to executive recommendations—because structured, decision-driven evidence is what turns a non-traditional background into a hiring manager’s top choice.
Next Action: Select one target analyst role and start a project that directly mirrors its core responsibilities. Document your entire process from raw dataset to final recommendation—this structured evidence makes a non-traditional background clear, compelling, and easy for hiring teams to evaluate.