15 Free Power BI Courses to Learn Data Analytics Online
If you want to transition into data analytics without paying for an expensive bootcamp, exploring free Power BI courses is the most practical way to build industry-ready skills. This curated list features official Microsoft Learn pathways, top-tier online platforms, and hands-on video training covering the core pillars of modern business intelligence: Power Query, data modeling, DAX, and interactive dashboard design.
Power BI is Microsoft’s premier business intelligence platform designed for connecting disparate data sources, transforming raw data, and building scalable visualization reports. Mastering it is essential for aspiring data analysts, finance professionals, business strategists, and advanced Excel users looking to upgrade their data capabilities.
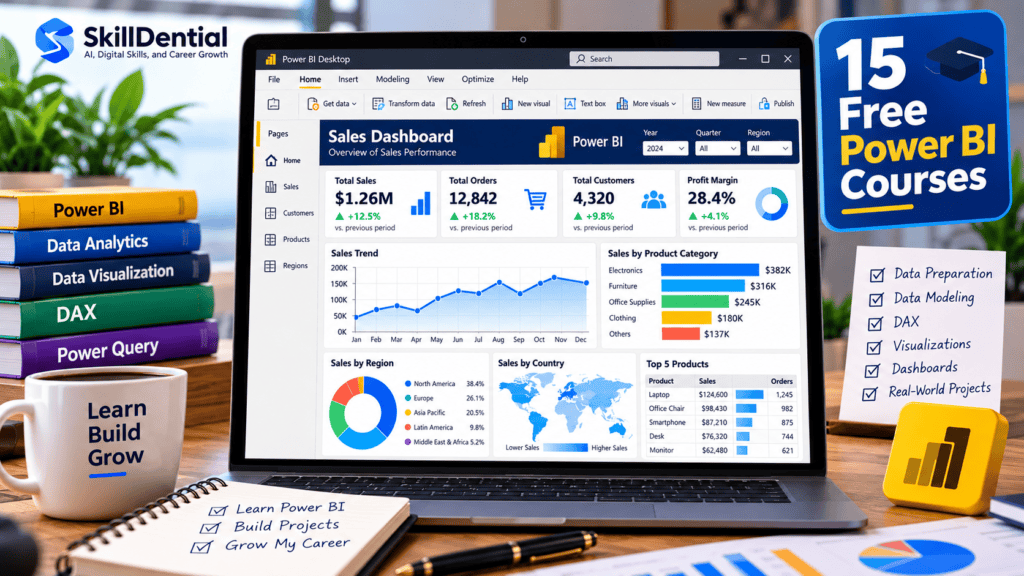
To ensure a seamless learning curve, the comprehensive selection of free Power BI courses outlined below has been strategically structured to guide you systematically—taking you from absolute foundational concepts all the way to building advanced, portfolio-worthy reporting workflows that demonstrate real-world analytical competence.
What Is Power BI?
Power BI is an industry-standard suite of Microsoft business intelligence tools and cloud services designed to ingest disparate data sources, transform and model raw data, and build interactive, decision-grade visual reports.
For a practitioner, mastering data analytics through free Power BI courses involves developing a cohesive stack of interconnected competencies rather than just learning surface-level chart design:
- Data Ingestion:Connecting seamlessly to local and cloud repositories, including Excel spreadsheets, relational SQL databases, web data, and enterprise APIs.
- Data Transformation: Cleaning, shaping, and restructuring data schemas at scale using the Power Query Editor.
- Data Modeling:Defining primary-to-foreign key relationships and structuring efficient star schemas to optimize query performance.
- Advanced Calculations: Writing scalable business logic and custom metrics using Data Analysis Expressions (DAX).
- Visual Storytelling & Layouts:Designing dynamic charts, matrices, KPIs, and interactive dashboards equipped with custom slicers and filters.
- Governance & Deployment:Publishing, securing, and sharing workspace reports across organizational stakeholders via the Power BI Service.
Mastering these essential competencies as a fully integrated, end-to-end workflow is precisely what separates a genuinely proficient data analyst from a surface-level, basic report builder.
15 Free Power BI Courses
Explore this curated selection of free Power BI courses featuring official Microsoft pathways, top-tier e-learning modules, and hands-on video tutorials designed to take you from data beginner to job-ready analyst.
Microsoft Learn: Prepare and Visualize Data With Power BI
- Best for: Beginners who want an official Microsoft starting point
- Level: Beginner
- Duration: About 8 hours 12 minutes
- Provider: Microsoft Learn
This is one of the strongest options for someone starting Power BI from scratch. Microsoft’s learning path covers connecting to data, transforming and shaping data, and creating interactive visuals in Power BI reports.
It is particularly useful because the course follows the actual Power BI workflow rather than treating individual features as isolated lessons.
You can expect to learn:
- Power BI fundamentals
- Connecting to data
- Data preparation
- Power Query
- Data visualization
- Interactive reports
- Why choose it: It is official Microsoft training and provides a structured introduction to the platform.
- Cost: Free learning path
- Course: Microsoft Learn — Prepare and Visualize Data With Power BI
Prepare and Visualize Data with Microsoft Power BI offers an informative webinar overview walking through certification-aligned fundamentals and practical data visualization techniques.
Microsoft Learn: Get Started With Microsoft Data Analytics
- Best for: Beginners who want to understand the modern data analyst workflow
- Level: Intermediate (according to Microsoft Learn, though the introductory modules are fully accessible to absolute newcomers)
- Duration: About 1 hour 28 minutes
- Provider: Microsoft Learn
Before diving straight into technical features, it pays to understand what data analysts actually do day-to-day. This foundational learning path links core business intelligence concepts directly to the Power BI ecosystem.
It provides critical context by walking you through the end-to-end data lifecycle—illustrating how raw operational data is transformed into trusted executive insights.
You can expect to learn:
- Types of data analytics
- Data analyst roles and responsibilities
- Core analytics tasks
- Power BI fundamentals
- Creating interactive reports
- Introduction to Copilot in Power BI
- Why choose it: It provides essential conceptual context before you tackle the technical side of building complex free Power BI courses curricula.
- Cost: Free
- Course: Microsoft Learn — Get Started With Microsoft Data Analytics
Microsoft Learn: Prepare Data for Analysis With Power BI
- Best for:Learners who want to master Power Query and data preparation
- Level: Intermediate
- Duration:About 4 hours 33 minutes
- Provider: Microsoft Learn
Data preparation is one of the most foundational pillars of effective data analytics. A visually striking dashboard has little business value if the underlying data architecture is messy, inconsistent, or poorly structured.
This targeted learning path zeroes in on the mechanics of data ingestion and transformation, ensuring you can turn raw, disparate inputs into clean, analysis-ready datasets.
You will learn about:
- Connecting to diverse data sources (Excel, SQL databases, cloud stores)
- Importing data efficiently
- Leveraging Power Query for data wrangling
- Cleaning, transforming, and shaping rows and columns
- Managing data types and performing column profiling
- Selecting optimal storage modes and performance considerations
- Why choose it: It is an essential module for aspiring analysts who understand basic navigation and want to bridge the gap toward rigorous, production-grade data engineering within free Power BI courses.
- Cost: Free
- Course: Microsoft Learn — Prepare Data for Analysis With Power BI
Microsoft Learn: Model Data With Power BI
- Best for: Aspiring data analysts who want to master data modeling and semantic structures
- Level: Intermediate
- Duration:About 5 hours 50 minutes
- Provider: Microsoft Learn
Data modeling is where Power BI transforms from a basic dashboarding tool into a powerful analytical engine.
This learning path teaches you how to structure prepared data into a robust semantic model, establish correct table relationships, and write custom metrics using DAX (Data Analysis Expressions).Microsoft recommends having basic familiarity with Power BI Desktop and core data concepts before diving in.
Topics include:
- Building optimized data models and star schemas
- Managing cardinality and table relationships
- Designing semantic models
- Implementing foundational calculations
- Introduction to DAX syntax and logic
- Core model design best practices
- Why choose it: Strong data modeling skills are the primary differentiator when transitioning from simple surface-level dashboards to professional, scalable enterprise analytics work.
- Cost: Free
- Course: Microsoft Learn — Model Data With Power BI
Microsoft Learn: Use DAX in Semantic Models
- Best for: Learners who want to move beyond basic Power BI and master analytical calculations
- Level: Intermediate
- Duration: About 3 hours 23 minutes
- Provider: Microsoft Learn
DAX (Data Analysis Expressions) is the proprietary formula language used in Power BI for creating advanced custom metrics and analytical calculations.
This learning path focuses specifically on computation logic rather than introductory dashboard creation, making it an ideal next step after covering data preparation and basic modeling within free Power BI courses.
You can expect to learn:
- DAX formula fundamentals and data types
- Building calculated tables and calculated columns
- Crafting efficient explicit measures
- Leveraging iterator functions
- Time-intelligence calculations for trend and growth analysis
- Configuring visual calculations directly on reports
- Why choose it: It zeroes in on the technical calculation layer, helping you solve complex business logic challenges that separate novice report builders from expert data analysts.
- Cost: Free learning path
- Course: Microsoft Learn — Use DAX in Semantic Models
Microsoft Learn: Design Effective Reports in Power BI
- Best for: Learners who want to transition from basic charts to professional, executive-ready dashboard design
- Level: Intermediate
- Duration: About 5 hours 7 minutes
- Provider: Microsoft Learn
Creating a high-impact report is never about packing a canvas with as many charts as possible; it requires intentional visual hierarchy, user-centric navigation, and clean data storytelling.
This comprehensive learning path bridges the gap between knowing technical Power BI features and effectively communicating business value to stakeholders.
You will explore:
- Professional report layout and design principles
- Optimal visual selection for different data types
- Advanced use of filters, slicers, and synchronizations
- Intuitive report navigation using buttons and bookmarks
- Designing mobile-optimized reports
- Performance optimization for smoother report rendering
- Built-in analytics features and data storytelling techniques
- Why choose it: It elevates your output from cluttered spreadsheets to polished enterprise dashboards, making it an essential module within any structured sequence of free Power BI courses.
- Cost: Free learning path
- Course: Microsoft Learn — Design Effective Reports in Power BI
Microsoft Learn: Dashboard in a Day
- Best for: Beginners who prefer a project-oriented, hands-on introduction to reporting
- Level: Beginner
- Duration: About 7 hours 21 minutes for the associated learning path
- Provider: Microsoft Learn / Partner Ecosystem
“Dashboard in a Day” is one of Microsoft’s most popular structured workshop blueprints, built specifically around end-to-end report and dashboard creation.
It provides a highly practical route through the ecosystem by taking you straight into real-world asset development rather than abstract theory. While often delivered as an official live, instructor-led workshop via Microsoft partners, the core instructional modules and datasets are fully accessible online.
You can expect to learn:
- Power BI desktop installation and workspace overview
- Connecting to disparate data sources
- Performing rapid initial data preparation
- Building core visual reports from scratch
- Assembling and publishing interactive dashboards
- Sharing insights across team environments
- Why choose it: It is arguably the best option if you want to bypass prolonged theory and learn core free Power BI courses concepts through an accelerated, project-based dashboard-building workflow.
- Cost:Free online learning materials (live instructor-led seats vary by regional partner availability).
- Course: Microsoft Learn — Dashboard in a Day
Alison: Introduction to Power BI
- Best for: Absolute beginners looking for a straightforward, accessible introduction to business analytics
- Level: Beginner
- Estimated study time:3–4 hours
- Provider:Alison
This structured online course introduces the core environment of Power BI and its overarching role in modern data analysis and visualization.
It covers foundational operations such as setting up the workspace, importing databases, and moving data from web sources into professional reports.
You can expect to learn:
- Installing and configuring Power BI Desktop
- Connecting to diverse data sources and cloud repositories
- Working with databases and cloud data connectors
- Using DirectQuery configurations
- Basic data transformation workflows
- Methods for publishing and sharing initial analysis
- Why choose it: It provides a rapid, high-level overview for learners who want a quick onboarding experience before tackling a more exhaustive curriculum of free Power BI courses.
- Cost:Free to study and complete the course modules. Note that digital or physical certification options are handled separately by the platform.
Alison: Introduction to Data Analytics Using Microsoft Power BI
- Best for: Beginners interested specifically in an analytics-focused framework
- Level: Beginner
- Estimated study time:1.5–3 hours
- Provider:Alison
This course seamlessly combines foundational Power BI mechanics with a focused data analytics perspective.
It bridges general software navigation with practical analysis workflows, making it a valuable onboarding resource if you are exploring these platforms as part of a broader data curriculum.
You can expect to learn:
- Distinguishing between Power BI Desktop and Power BI Online
- Transforming and customizing datasets using real-world scenarios
- Building powerful data visualizations from raw inputs
- Working with larger datasets and asking questions of data in plain language
- Managing dashboard sharing via direct email links or URLs
- Why choose it: Its targeted data-analytics framing makes it exceptionally useful for students and career switchers who want to contextualize free Power BI courses within a broader professional skillset.
- Cost: Free course access and digital study materials (optional formal certificates involve a separate processing fee).
- Course:Alison — Introduction to Data Analytics Using Microsoft Power BI
Alison: Fundamental Data Analysis Using Power BI
- Best for:Beginners who want a short, conceptual introduction to Power BI analysis
- Level:Beginner
- Estimated study time:1.5–3 hours
- Provider:Alison
This course focuses on the fundamental tools and baseline functions required to begin performing data analysis within the Power BI ecosystem.
It provides a lightweight look at core software architecture without dragging you down into lengthy technical documentation.
You will introduce yourself to:
- Power BI workspace basics and general navigation
- Essential tools and helper functions
- Managing and recognizing different data types
- Core visualization types and layout similarities
- Observing operational changes inside Power BI Desktop
- Key distinctions between standalone reports and live dashboards
- Why choose it: It is short, direct, and efficient enough to use as a lightweight conceptual primer before jumping into heavier free Power BI courses and hands-on modeling tracks.
- Cost: Free course access (optional digital certification options involve separate platform fees).
- Course:Alison — Fundamental Data Analysis Using Power BI
Alison: Introduction to Analysis With Power BI Desktop
- Best for:Learners ready to transition into modeling, Power Query transformations, and DAX calculations
- Level: Advanced (according to Alison’s platform classification)
- Estimated study time:3–4 hours
- Provider:Alison
This course moves past basic interface navigation to explore the deep analytical capabilities of the platform. It serves as a practical bridge for anyone looking to master the technical mechanics that drive professional reports.
Topics include:
- Power BI analysis workflows
- Advanced data visualization and chart building
- Power Query features, item exploration, and M code fundamentals
- Merging complex datasets from multiple source systems
- Writing custom calculations using DAX
- Time-intelligence functions and parameters
- Why choose it: It acts as an efficient bridge between basic introduction courses and technical data modeling tracks within your catalog of free Power BI courses.
- Cost:Free course access and digital study materials (optional formal certificates involve a separate processing fee).
- Course:Alison — Introduction to Analysis With Power BI Desktop
Alison: Master Microsoft Power BI
- Best for:Learners who want broader coverage of Power BI reporting and visualization features
- Level: Advanced (according to Alison’s catalog)
- Estimated study time:3–4 hours
- Provider:Alison
This course focuses heavily on turning raw datasets into meaningful, interactive data visualizations and executive-ready reports. It cuts through surface-level tutorials to look at how presentation design impacts business decision-making.
It covers:
- Power BI core ecosystem components
- Practical distinctions between reports and interactive dashboards
- Meaningful data visualization selection and design
- Structural contrasts between Power BI and Excel
- Configuring report filters, slicers, and conditional formatting
- Mobile report considerations and cross-platform layouts
- Overview of different Power BI versions and licensing offerings
- Why choose it: It is a valuable addition for learners who already understand basic software navigation and want to explore professional reporting and aesthetic visualization techniques more deeply.
- Cost:Free course access and digital modules (optional certification or diploma options may involve platform fees).
- Course: Alison — Master Microsoft Power BI
Simplilearn SkillUp: Power BI for Beginners
- Best for: Beginners who want a structured, self-paced video introduction paired with a shareable completion certificate
- Level: Beginner
- Duration: About 6 hours of self-paced video lessons
- Provider: Simplilearn SkillUp
Simplilearn’s popular free offering covers several of the fundamental skills required for practical work across free Power BI courses. It blends theory with practical demonstrations to help new users navigate the workspace.
Topics include:
- Power BI Desktop navigation and setup
- Power Query and data wrangling
- Core DAX calculations and filter contexts
- Data modeling principles and relationship-building
- Creating reports and interactive dashboards
- Practical case studies demonstrating end-to-end insights
- Why choose it: It provides 90 days of free course access alongside a formal digital completion certificate at no cost, making it one of the strongest choices if proof of completion is important for your portfolio or LinkedIn profile.
- Cost: Free (via the SkillUp platform).
- Course: Simplilearn SkillUp — Power BI for Beginners
Simplilearn SkillUp: Power BI Data Modeling With DAX
- Best for:Learners who want to strengthen data modeling, semantic architecture, and DAX calculations
- Level: Beginner to Intermediate
- Duration: About 6 hours of self-paced video modules
- Provider: Simplilearn SkillUp
If you already understand the basics of Power BI interface navigation, this course focuses on the critical next step: building efficient semantic schemas and writing high-performance analytical calculations.
The course covers:
- Power BI data modeling fundamentals and star/snowflake schemas
- Managing table relationships, cardinality, and cross-filter directions
- Data-model structure and optimization
- Essential DAX formulas, operators, and explicit measures
- Using
CALCULATEto manipulate filters and context - Time intelligence functions and analytical modeling
- Why choose it: It is particularly relevant for learners preparing for professional data analyst work rather than just basic dashboard design, and it includes 90 days of free access alongside a verifiable completion certificate.
- Cost:Free (via SkillUp).
- Course: Simplilearn SkillUp — Power BI Data Modeling With DAX
YouTube: Power BI Beginner Tutorial
- Best for: Learners who prefer long-form video tutorials and watching a developer build models in real-time
- Level: Beginner
- Format: Comprehensive video tutorial
- Provider:Learn Skills Daily / YouTube
YouTube can be a surprisingly useful source of high-quality free Power BI courses, particularly when you want to watch someone work through the software interface rather than just read static text documentation.
This popular beginner tutorial covers core application areas such as:
- Navigating Power BI Desktop and workspace layouts
- Connecting to local and cloud data sources (including Excel files)
- Leveraging Power Query for basic data cleanup
- Establishing table relationships and data views
- Designing report canvases and interactive visualizations
- Assembling dashboards and publishing/refreshing data
- Why choose it: It provides an immersive, follow-along visual experience, allowing you to learn entirely through video demonstration without committing to a paid learning platform.
- Cost: Free to watch.
- Course: YouTube — Power BI Beginner Tutorial (Learn Skills Daily)
Which Free Power BI Course Should You Choose?
The right free Power BI course for you depends entirely on your current skill level, technical background, and specific learning goals. Use this breakdown to find your ideal starting point:
| Your Situation | Recommended Starting Point |
| Completely new to Power BI | Microsoft Learn: Prepare and Visualize Data With Power BI |
| New to data analytics | Microsoft Learn: Get Started With Microsoft Data Analytics |
| Want to learn Power Query | Microsoft Learn: Prepare Data for Analysis With Power BI |
| Want to understand data modeling | Microsoft Learn: Model Data With Power BI |
| Want to learn DAX | Microsoft Learn: Use DAX in Semantic Models |
| Want better dashboards | Microsoft Learn: Design Effective Reports in Power BI |
| Prefer a structured general course | Simplilearn Power BI for Beginners |
| Want a free completion certificate | Simplilearn SkillUp Power BI courses |
| Prefer short lessons | Alison’s introductory Power BI courses |
| Prefer video learning | YouTube Power BI tutorials |
| Already know the basics | Alison’s advanced Power BI courses or Microsoft’s modeling/DAX paths |
A Free Power BI Learning Path for Beginners
Instead of attempting to consume all 15 courses simultaneously, you can map them into a high-efficiency, progressive learning path:
Step 1: Understand Data Analytics
Start by learning what data analysts actually do and how raw inputs move from a business question to actionable insight.
- Recommended Resource: Microsoft Learn: Get Started With Microsoft Data Analytics
Step 2: Learn the Power BI Interface
Next, learn how Power BI Desktop works under the hood and understand its core workflow:
$$\text{Data Source} \rightarrow \text{Power Query} \rightarrow \text{Data Model} \rightarrow \text{Report} \rightarrow \text{Insights}$$
Do not worry about complex DAX calculations or advanced data architecture at this early stage.
Step 3: Master Power Query
Once you are comfortable navigating the application, focus heavily on cleaning, shaping, and transforming data. Practice high-frequency operational tasks such as:
- Removing unnecessary columns and handling null values
- Changing data types and renaming fields
- Filtering, splitting, and merging disparate tables
Recommended Resource: Microsoft Learn: Prepare Data for Analysis With Power BI
Step 4: Build Robust Data Models
After learning how to clean datasets, transition to semantic data modeling and table relationships. Understand how relational components connect efficiently:
- Customers
- Products
- Orders / Transactions
- Date / Calendar tables
Step 5: Learn DAX (Data Analysis Expressions)
Once your data models are structured, introduce functional calculation logic using DAX. Begin with straightforward explicit measures before advancing to complex logic:
- Total Sales & Total Orders
- Average Sales & Profit Margins
- Time-intelligence functions (Year-to-Date, Month-over-Month growth)
- Recommended Resource: Microsoft Learn: Use DAX in Semantic Models
Step 6: Design Impactful Dashboards
Move past isolated charts to assemble unified, user-friendly reports. Practice layout and visual storytelling around real-world industry domains:
- Sales performance and regional revenue
- Customer churn and retention metrics
- HR analytics and workforce dynamics
- Financial reporting and executive balance sheets
Step 7: Build a Job-Ready Portfolio
Do not stop at completing tutorials. Build and publish at least three end-to-end Power BI projects showcasing distinct operational workflows:
- Project 1:Sales and Profitability Dashboard (emphasizing star-schema design and regional KPIs)
- Project 2: HR Analytics Dashboard (tracking workforce demographics, headcounts, and turnover trends)
- Project 3: Customer Churn Dashboard (highlighting segment analysis, risk factors, and retention behaviors)
Do You Need Excel Before Learning Power BI?
No, you do not need to be an advanced Excel user before diving into free Power BI courses.
However, possessing basic spreadsheet familiarity can make the transition smoother, as Power BI frequently handles tabular structures and imports data directly from Excel workbooks.
If you already understand core concepts such as:
- Rows, columns, and rectangular data arrays
- Standard tables and named ranges
- Basic formulas and arithmetic operations
- Sorting, filtering, and conditional formatting
- PivotTables and PivotCharts
You will find that many foundational Power BI concepts feel intuitive. That said, you can easily learn Excel mechanics and Power BI workflows alongside each other without hitting a hard prerequisite barrier.
Should Excel Users Learn Power BI?
What you need to know offers a great breakdown of how traditional spreadsheet workflows transition directly into modern automated business intelligence.
Is Power BI Completely Free?
Power BI has robust free components, but the full answer depends on what you intend to do with the platform.
Power BI Desktop is completely free to download, install, and use locally.You can connect to data sources, use Power Query, build complex data models, write DAX calculations, and design comprehensive reports without ever paying a cent.
However, Microsoft’s broader ecosystem splits capabilities across different tiers:
- Power BI Desktop ($0):Free for individual learning, personal report creation, and local prototyping.
- Power BI Pro (~$14 per user/month):Required if you want to publish, share, and collaborate on reports with other team members in the cloud.
- Enterprise & Capacity Options:Advanced organizational deployment options, such as Premium Per User (PPU) or Microsoft Fabric capacities, handle large-scale data governance and broad distribution.
Why This Matters for Learners
This distinction is important when choosing a course. A training program can be 100% free to study (because you only need Power BI Desktop to follow along), but professional collaboration, publishing, or sharing your work online may eventually require a paid organizational license or specific workspace setup.
For the explicit purpose of learning foundational concepts, mastering practical workflows, and building a robust professional portfolio from scratch, Power BI Desktop provides all the core modeling, transformation, and visualization capabilities you need entirely at no cost.
Are Free Power BI Courses Enough to Get a Job?
A free course can teach you valuable Power BI skills, but completing a course alone does not automatically make you job-ready.
Hiring managers and employers ultimately care about execution and evidence of capability over course completion badges. To stand out in a competitive job market, you must be able to demonstrate that you can:
- Import and connect multiple disparate data sources
- Clean, transform, and shape data using Power Query
- Build efficient relationships and logical data models
- Write practical, high-performing DAX measures
- Design clean, interactive reports
- Translate technical data findings into clear insights for non-technical stakeholders
This is precisely why practical projects are indispensable. A self-taught candidate who has built three strong, end-to-end Power BI projects will almost always demonstrate more practical ability—and secure more interviews—than someone who has accumulated ten course certificates without building anything tangible.
Common Mistakes to Avoid When Learning Power BI
Avoid these five common pitfalls—from over-collecting course certificates to neglecting data models—to accelerate your progress and build job-ready analytics skills faster.
Taking Too Many Courses
You do not need to take all 15 courses. The purpose of this list is to provide curated options tailored to different learning styles and experience levels. Choose one primary beginner course and utilize additional modules only when you need to bridge a specific skill gap.
Focusing Exclusively on Visual Design
Power BI is much more than charts, colors, and themes. Data preparation, cleaning, relationship structures, and DAX calculations form the technical backbone of professional data analytics and are critical for building reliable reports.
Memorizing DAX Without Understanding the Model
DAX formulas can feel confusing or overly complex if you try to memorize syntax in a vacuum. Always master your underlying table structures and relationships first; clear data models make writing analytical measures significantly more intuitive.
Watching Tutorials Without Practicing
Passive learning creates a false illusion of competence. Simply watching video walkthroughs or reading documentation will not build muscle memory. Open Power BI Desktop alongside every lesson, reproduce what you see, and then challenge yourself by modifying the project to solve a unique data problem.
Assuming Every Certificate Carries Equal Weight
A standard course-completion badge is entirely different from a formal, proctored professional certification. For example, finishing a free online course does not make you a Microsoft Certified: Power BI Data Analyst. If formal validation is your primary career goal, research official exam pathways (such as Microsoft Exam PL-300) separately.
How to Practice Power BI for Free
You do not need expensive proprietary datasets or paid software extensions to practice data analytics effectively.
Leverage Free Data Repositories
You can download clean, real-world CSV and Excel files instantly from industry-standard free platforms:
- Maven Analytics Data Playground:Offers clean, multi-table business datasets (like e-commerce sales, restaurant transactions, and supply chain logs) equipped with suggested analytical questions.
- Kaggle Datasets:The world’s largest repository for free community datasets spanning retail, healthcare, finance, and marketing.
- Microsoft Power BI Sample Datasets:Official built-in or downloadable templates (such as the classic Financials or Retail Analysis workbooks) provided directly by Microsoft.
Apply the Three-Tier Analytical Framework
When you load a dataset into Power BI Desktop, avoid just building random charts. Interrogate the data using three progressive tiers of questioning:
- What happened? (Descriptive Analytics) Look at raw totals, high-level trends, timelines, and distributions. Map out baseline revenue, top-selling items, and volume over time.
- Why did it happen? (Diagnostic Analytics) Break the data down granularly across dimensions—such as product category, geographical location, customer segment, store department, or seasonal periods—to uncover root causes and performance anomalies.
- What should the business do next? (Prescriptive Analytics) Use your visual narrative and custom metrics to highlight actionable risks (like customer churn spikes or inventory shortages) and recommend specific strategic steps.
What Should You Learn After Power BI?
Power BI is a powerful visualization and modeling asset, but it delivers maximum career leverage when paired with complementary data skills.
A practical, high-demand progression looks like this:
$$\text{Excel} \rightarrow \text{Power BI} \rightarrow \text{SQL} \rightarrow \text{DAX} \rightarrow \text{Data Storytelling} \rightarrow \text{Python}$$
You do not need to follow this exact sequential path rigidly, but focusing on core competencies ensures long-term career growth:
- SQL (Structured Query Language):If Power BI helps you visualize data, SQL is how you retrieve it from enterprise databases.For anyone targeting entry-level data analyst roles, the combination of Excel + SQL + Power BI forms an absolute non-negotiable foundation.
- Advanced Statistics:Understanding core concepts like distributions, correlation, and sample significance ensures you draw accurate business conclusions rather than misinterpreting raw numbers.
- Python:Once your datasets outgrow spreadsheet limits or manual workflows become repetitive, Python (using libraries like
pandasandNumPy) expands your toolkit into advanced data manipulation, scripting, and automation.
Mastering these supplementary technical layers progressively transforms you from a narrow, single-tool report builder into a genuinely well-rounded, highly versatile, and strategic data professional capable of solving complex organizational challenges across the entire analytical lifecycle.
Are these free Power BI courses truly 100% free?
Yes. All the primary courses featured in this guide—including official Microsoft Learn learning paths, Alison modules, and Simplilearn SkillUp video lessons—can be studied and completed at no financial cost.
However, keep in mind that some online course platforms charge optional fees if you want an official printed certificate, a verified digital badge, or premium downloadable resources. For learning the software itself, you will never need to pay a cent, as Power BI Desktop is completely free to download and use locally.
Do I need to know Excel before starting these free Power BI courses?
No, advanced Excel is not a strict prerequisite. While having a basic grasp of spreadsheets (such as understanding rows, columns, simple sorting, and basic tables) can make your initial transition smoother, Power BI is built to be learned from scratch. Many beginners successfully learn spreadsheet concepts and Power BI workflows side by side.
Can I get a job using only free Power BI courses?
Yes, but completion badges alone will not land you a role. Hiring managers evaluate candidates based on execution, problem-solving, and proof of capability.
If you use these free courses to master Power Query, data modeling, DAX, and dashboard design, and then build a portfolio featuring at least three end-to-end analytical projects, you can successfully compete for junior data analyst and business intelligence roles without spending money on an expensive bootcamp.
What is the difference between a free course certificate and the Microsoft PL-300 certification?
Free Course Certificates: Digital badges issued by learning platforms (like Simplilearn or Alison) verifying that you finished their specific curriculum.
Microsoft PL-300 Certification: An official, proctored industry credential (Microsoft Certified: Power BI Data Analyst Associate) administered via Pearson VUE.
While free course certificates are great for LinkedIn, the PL-300 exam ($165 USD) is the recognized global standard that validates professional competence for employers.
Do I need a paid license to practice Power BI at home?
No. Power BI Desktop is a fully featured, free application. You can ingest data, run Power Query scripts, build semantic data models, write complex DAX calculations, and design complete visual reports locally on your computer without any subscription or license.
You only encounter paid licensing requirements (such as Power BI Pro at $14/month) if you want to publish, share, and collaborate on cloud workspaces with other enterprise users.
In Conclusion
You do not need to spend thousands of dollars on an expensive bootcamp to break into data analytics. The curated selection of free Power BI courses outlined in this guide provides multiple reliable routes into the field—ranging from official Microsoft Learn pathways to self-paced platform modules and comprehensive video walkthroughs.
If you are a complete beginner, resist the urge to collect certificates or consume all 15 courses at once. Instead, follow a disciplined execution loop: pick one primary foundational course, master the core workflow from Power Query to data modeling, write clean DAX calculations, and immediately validate your skills by building real-world projects.
Your next step
To secure a strong foundation, choose a single beginner course from this list today, fire up Power BI Desktop to follow along hands-on, and commit to building your very first complete dashboard from scratch before jumping into any subsequent training modules.