Should I Learn Excel, SQL, Power BI, or Python First?
If you are wondering whether to learn Excel, SQL, Power BI, or Python first, Excel is usually the best starting point. It helps you build confidence in organizing, analyzing, and interpreting data before progressing to SQL for database queries, Power BI for interactive dashboards, and Python for automation and advanced analytics.
This guide is designed for students, career switchers, and early-career professionals interested in data analysis, business analysis, or reporting roles. It explains what each tool does, how difficult it is to learn, how employers use it, and the most practical learning order to follow without becoming overwhelmed.
What each tool is used for
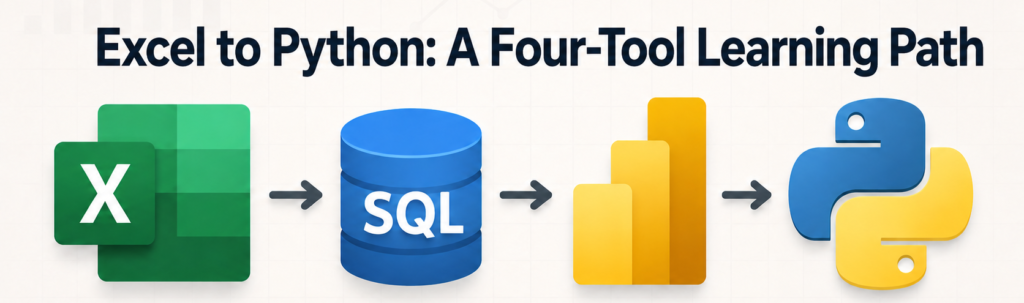
Before deciding which tool to learn first, it helps to understand each tool’s role. Excel, SQL, Power BI, and Python can all be used to work with data. Still, they serve different purposes—from organizing spreadsheets and retrieving database records to building dashboards, automating tasks, and performing advanced analysis.
Excel: The universal spreadsheet for everyday analysis
When you learn Excel, you master the universal spreadsheet application used for organising data, performing calculations, creating pivot tables, and building quick reports. It is ideal for datasets under ~1 million rows, ad‑hoc analysis, and prototyping logic before moving to other tools. Most entry-level analyst roles expect strong Excel skills, including formulas, pivot tables, and Power Query.
SQL: The language for querying databases
SQL (Structured Query Language) is used to retrieve, filter, join, and aggregate data stored in relational databases. It is the standard way analysts access production data, validate metrics, and prepare datasets for reporting or further analysis. SQL scales far beyond what you can achieve when you learn Excel alone, especially when working with large, multi-table datasets.
Power BI: Business intelligence and interactive dashboards
Power BI is Microsoft’s business analytics platform for connecting to multiple data sources, modelling data, and creating interactive reports and dashboards. It is designed for governed, shared analytics, automated refresh, row-level security, and consumption by many users across an organisation. Power BI integrates tightly with Excel and SQL, making it a natural next step after you learn Excel and database querying.
Python: Programming for automation, advanced analytics, and machine learning
Python is a general-purpose programming language widely used in data science for cleaning data, automating workflows, performing statistical analysis, and building machine learning models. Libraries like pandas, NumPy, and scikit-learn extend Python’s capabilities far beyond what SQL or BI tools can do alone.
Python becomes valuable once you move past the limits of what you learn in Excel to accomplish, particularly when you need repeatability, complex transformations, or predictive modelling.
Difficulty and learning curve comparison
Excel, SQL, Power BI, and Python have different learning curves depending on your background and goals. This comparison explains how difficult each tool is for beginners, how quickly you can learn the basics, and which one requires more time and practice to use confidently.
| Tool | Typical time to basics | Typical time to job-ready | Learning curve |
| Excel | 4–15 hours | 20–40 hours for advanced features | Gentle; familiar interface |
| SQL | 2–4 weeks | 1–3 months for analyst-level queries | Moderate; syntax is straightforward but concepts like joins and subqueries take practice |
| Power BI | 2–4 weeks | 1–3 months for solid dashboards | Moderate; easier if you know Excel and SQL |
| Python | 4–8 weeks | 3–6+ months for data analysis workflows | Steeper; requires programming logic and library knowledge |
When you learn Excel and SQL first, you get the fastest confidence boost for beginners. Python has the steepest initial curve when you transition away from what you learn Excel to do, but it offers the most flexibility long term.
Career relevance: which roles use which tools?
Different careers require different combinations of Excel, SQL, Power BI, and Python. Understanding which professionals use each tool will help you prioritize the skills most relevant to your desired role instead of trying to learn everything at once.
| Role | Core tools | Nice-to-have |
| Junior Data Analyst | Excel, SQL, Power BI/Tableau | Python (basic) |
| Business Analyst | Excel, SQL, Power BI | Python (optional) |
| Reporting Analyst | Excel, SQL, Power BI | — |
| BI Analyst / Developer | SQL, Power BI | Python (for advanced ETL) |
| Data Analyst (mid/senior) | SQL, Power BI/Tableau, Python | Advanced statistics, cloud tools |
| Data Scientist | Python, SQL | Power BI/Tableau (for stakeholder reporting) |
Reality check: Many analyst interviews stop at medium-level SQL and strong skills you build when you learn Excel and Power BI. Python becomes critical once you move past what you learn in Excel to do for data science, machine learning, or heavy automation roles.
When you should learn Excel first
You should learn Excel first if you are new to data, need practical workplace skills, or want to build a strong foundation before moving to more advanced tools. Excel is especially useful for office administration, finance, accounting, business analysis, reporting, and entry-level data roles.
When you learn Excel first, you set the ideal baseline if you:
- Are completely new to working with data.
- Want the fastest path to confidence and early wins.
- Target roles like business analyst, reporting analyst, or operations analyst.
- Need to analyse small-to-medium datasets quickly without coding.
- Work in organisations that still rely heavily on spreadsheets.
When you learn Excel early, it teaches foundational concepts—formulas, filtering, pivot tables, and basic data cleaning—that transfer directly to SQL and Power BI.
Recommended learning order for beginners
For most beginners, the recommended learning order is Excel, SQL, Power BI, and then Python. This progression builds practical spreadsheet skills first, followed by database querying, data visualization, and finally automation and advanced analytics. However, the best order may vary depending on your career goals.
The most efficient path for 80% of beginners follows a structured progression:
- Excel (1–4 weeks): When you learn Excel first, master formulas, pivot tables, Power Query, and basic charts to build a strong analytical foundation.
- SQL (1–3 months): Learn
SELECT,WHERE,GROUP BY,JOINs, subqueries, and window functions to query relational databases directly. - Power BI (1–3 months): Build dynamic dashboards, learn DAX basics, and connect your Power BI models directly to the Excel and SQL sources you already understand.
- Python (3–6+ months, optional for analysts): Once you move past what you learn in Excel to handle, focus on pandas, data cleaning, automation, and basic visualisation.
Alternative paths by career goal
The best learning path depends on the career you want to pursue. While many beginners should learn Excel first, aspiring data analysts, business intelligence professionals, data scientists, finance professionals, and automation specialists may need different combinations of Excel, SQL, Power BI, and Python.
- Business Analyst / Operations: Excel $\rightarrow$ SQL $\rightarrow$ Power BI (Python optional). This path prioritizes rapid reporting, ad-hoc spreadsheet manipulation, and database querying without requiring programming.
- Data Analyst (general): Excel $\rightarrow$ SQL $\rightarrow$ Power BI $\rightarrow$ Python (basic). This is the gold-standard trajectory for the modern data analyst, ensuring you can handle data from spreadsheet to database, visualization, and basic automation.
- BI Developer: SQL $\rightarrow$ Power BI (deep DAX/modeling) $\rightarrow$ Excel $\rightarrow$ Python (for ETL). This sequence inverts the traditional path by placing heavy database infrastructure and enterprise reporting front and center.
- Data Scientist: Excel $\rightarrow$ SQL $\rightarrow$ Python (pandas, scikit-learn) $\rightarrow$ Power BI/Tableau (for reporting). This route builds foundational spreadsheet and querying logic before diving deep into machine learning workflows and statistical modeling.
Common mistakes to avoid
Beginners often slow their progress by trying to learn every tool at once, focusing too much on theory, or moving to advanced topics before mastering the basics. Avoiding these common mistakes will help you build practical skills, stay consistent, and follow a learning path that matches your career goals.
- Trying to learn all four tools at once: This leads to cognitive overload, burnout, and shallow skills. Master one layer of the data stack before moving to the next.
- Starting with Python before Excel or SQL: Many beginners quit because the programming learning curve feels too steep when you are trying to learn coding logic and data analysis concepts simultaneously.
- Skipping SQL: SQL is non-negotiable for most analyst roles and is the only reliable way to unlock and extract real company data from relational databases.
- Ignoring Power BI after learning Excel and SQL: Interactive dashboards are how modern business stakeholders consume, audit, and act on insights; knowing how to query data isn’t enough if you can’t present it effectively.
- Over-investing in advanced Python before landing an analyst role: For most entry-level jobs, strong Excel, SQL, and Power BI skills matter far more than building machine learning models in Python.
Practical next steps
Once you have chosen the right learning path, the next step is to turn that decision into action. Start with one tool, follow a structured learning plan, practise with real-world projects, and gradually add the other skills required for your chosen career.
- Pick one tool and commit for 4–8 weeks: For most beginners, that starting point is when you learn Excel to establish core data logic and spreadsheet familiarity.
- Work on a small project: Take a single dataset—such as a retail sales CSV—analyse it when you learn Excel, then recreate those exact queries in SQL and scale the visualization in Power BI.
- Build a simple portfolio: Showcase your progression by publishing your polished dashboards, query scripts, or step-by-step documentation on GitHub or a professional portfolio site.
- Apply for junior roles once you can: Confidently write medium-level SQL queries, build a clean, interactive Power BI dashboard, and articulate your business insights clearly to non-technical stakeholders.
Is Excel still relevant in 2026?
Yes. Excel remains the default tool for quick analysis, prototyping, and core business workflows. Advanced skills you build when you learn Excel—such as pivot tables, Power Query, and complex formulas—are still listed in the vast majority of analyst job postings.
Can I skip Excel and start with SQL or Power BI?
You can, but it is not recommended for complete beginners. Taking the time to learn Excel first builds foundational data intuition, structural logic, and spreadsheet familiarity that makes mastering SQL and Power BI significantly easier later.
Do I need Python to become a data analyst?
Not for most entry-level analyst roles. Python becomes important when you move past what you learn in Excel and SQL to handle, specifically for advanced data science, machine learning pipelines, heavy automation, or specialized engineering paths.
How long does it take to become job-ready?
With focused study (5–10 hours/week), many learners become job-ready in 3–6 months by choosing to learn Excel, SQL, and Power BI in a structured sequence.
In Conclusion
Choosing which tool to master first doesn’t have to be a guessing game. When you learn Excel as your starting point, you build the core data intuition needed to tackle SQL, Power BI, and Python without burning out.
The most reliable path to a data career is sequential, not simultaneous. Lock down your spreadsheet fundamentals, open up a database with SQL, visualize your insights in Power BI, and save Python for when your workflow truly demands automation or advanced scale. Pick your first tool today, commit to a single project, and take your first step toward building a high-leverage data career.