9 SQL Business Intelligence Tips for Data Professionals
Effective SQL Business Intelligence (BI) development requires writing robust queries that bridge raw database schemas and high-level decision-making. High-performing reporting layers depend on clean, trusted metrics rather than brittle scripts.
These nine practical SQL Business Intelligence tips help data professionals eliminate duplicate rows, safely handle missing values, define consistent metrics, and optimize execution performance across database engines like PostgreSQL, MySQL, SQL Server, BigQuery, and Snowflake.
Terminology Note: While SQL Business Intelligence can encompass traditional Microsoft BI infrastructure (SSRS, SSAS, Power BI), this guide focuses on cross-platform, engine-agnostic SQL workflows essential for modern analytics workloads.
Who This Guide Is For
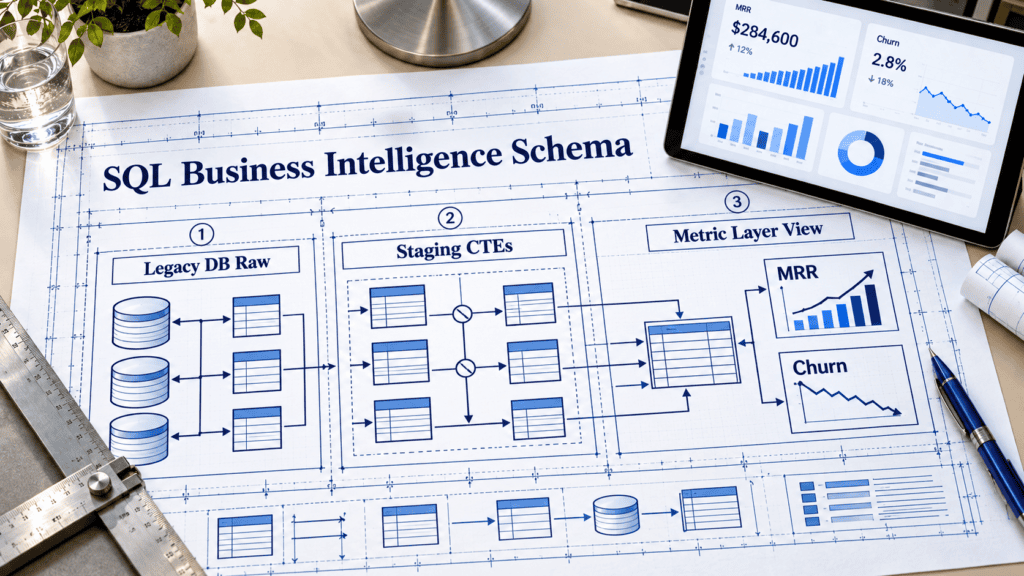
This framework targets data analysts, BI developers, and reporting engineers with foundational SQL capabilities (SELECT, JOIN, GROUP BY) who need to:
- Translate complex business requirements into dashboard-ready datasets and standardized metrics.
- Mitigate hidden data risks, including join-induced row multiplication and silent
NULLpropagation. - Write modular, high-performance queries that stakeholders and downstream analytics pipelines can trust.
Prerequisite Note: If you require a baseline refresher before diving into advanced SQL Business Intelligence workflows, explore foundational query tutorials (such as Mode’s interactive SQL course) to ground your technical practice.
Tip 1: Start with the Business Question, Not the Table
- The Answer: Define the metric specification (numerator, denominator, filters, and grain) before touching database tables. In SQL Business Intelligence workflows, this prevents “data-first” anti-patterns that dump raw columns without answering the actual business problem.
- Why It Matters: BI queries fail when they answer technical questions rather than strategic ones. Explicit metric definitions maintain strict alignment with stakeholder requirements and prevent logic drift across reporting layers.
SQL
-- Business Question: "What is monthly recurring revenue (MRR) by plan?"
-- Metric Definition:
--   - Numerator: SUM(monthly_price) for active subscriptions
--   - Denominator: None (Absolute metric)
--   - Filters: status = 'active', cancelled_at IS NULL
--   - Grain: One row per month and plan

SELECT
    DATE_TRUNC('month', started_at) AS month,
    plan_name,
    SUM(monthly_price) AS mrr
FROM subscriptions
WHERE status = 'active'
  AND cancelled_at IS NULL
GROUP BY 1, 2
ORDER BY 1, 2;Code language: PHP (php)
Common Mistake
Pulling all columns from a source table into a subquery or CTE and hoping the downstream dashboarding layer will “make sense” of the logic. Document metrics explicitly in version-controlled data dictionaries or inline query comments.
Tip 2: Avoid Duplicate Rows After Joins by Understanding Grain
- The Answer: Row inflation typically stems from joining tables at mismatched grains (such as one-to-many relationships). Prevent this by pre-aggregating detailed child tables into the target grain or using window functions to isolate a single record per key before performing joins.
- Why It Matters: Unchecked row duplication severely distorts aggregate metrics, ruins dashboard KPIs, and invalidates SQL Business Intelligence and reporting models. Relying on
DISTINCTas a quick fix only masks structural join errors rather than solving the underlying logic flaw.
SQL
-- Problem: Joining orders (one row per order) to order_items (many rows per order)
-- inflates metric counts if unaggregated.
-- Wrong (inflated calculation):
SELECT
    o.order_id,
    o.order_date,
    COUNT(*) AS item_count
FROM orders o
JOIN order_items oi ON o.order_id = oi.order_id
GROUP BY o.order_id, o.order_date;

-- Right: Aggregate child records first, then join
WITH items_per_order AS (
    SELECT
        order_id,
        COUNT(*) AS item_count
    FROM order_items
    GROUP BY order_id
)
SELECT
    o.order_id,
    o.order_date,
    i.item_count
FROM orders o
JOIN items_per_order i ON o.order_id = i.order_id;Code language: PHP (php)
Alternative Approach
Utilize window functions (such as
ROW_NUMBER()) inside a Common Table Expression (CTE) to deterministically pick a single row per key when your SQL Business Intelligence pipeline requires a strict one-to-one relationship from a multi-row source.
Tip 3: Handle NULLs Safely with COALESCE and NULLIF
- The Answer: Use
COALESCEto inject deterministic defaults for missing attributes andNULLIFto gracefully guard against runtime divide-by-zero errors. Never assumeNULLbehaves like a numeric zero. - Why It Matters: Unhandled
NULLvalues silently distort reporting metrics—such asAVG()functions completely droppingNULLrows rather than treating them as zero—and can cause production SQL Business Intelligence dashboards to throw runtime exceptions.
SQL
-- Safe average discount per customer (treats missing values as 0)
SELECT
    customer_id,
    AVG(COALESCE(discount_pct, 0)) AS avg_discount
FROM orders
GROUP BY customer_id;

-- Guard against divide-by-zero errors during unit price calculation
SELECT
    product_id,
    revenue / NULLIF(units, 0) AS revenue_per_unit
FROM product_sales;Code language: PHP (php)
Best Practices for BI Pipelines:
- Always use
IS NULLorIS NOT NULLto check for missing data; never use= NULL.- Prefer standard
COALESCEover engine-specific functions (IFNULL,ISNULL) to ensure cross-platform database portability.- Document column nullability contracts in your data dictionary to distinguish between unknown data and states where a value is not applicable.
Tip 4: Use CTEs to Make Multi-Step BI Logic Readable
- The Answer: Leverage Common Table Expressions (CTEs) to decompose complex queries into logical, named steps. This significantly enhances readability, maintainability, and ease of debugging compared to deeply nested subqueries.
- Why It Matters: SQL Business Intelligence pipelines typically require multi-phase transformations—such as filtering raw logs, aggregating at intermediate grains, and executing final joins. CTEs make this analytical pipeline explicit and modular within a single script.
SQL
WITH active_customers AS (
    SELECT customer_id
    FROM customers
    WHERE status = 'active'
),
monthly_orders AS (
    SELECT
        customer_id,
        DATE_TRUNC('month', order_date) AS month,
        COUNT(*) AS orders_count,
        SUM(amount) AS revenue
    FROM orders
    WHERE customer_id IN (SELECT customer_id FROM active_customers)
    GROUP BY 1, 2
)
SELECT
    month,
    COUNT(DISTINCT customer_id) AS active_customers,
    SUM(orders_count) AS total_orders,
    SUM(revenue) AS total_revenue
FROM monthly_orders
GROUP BY 1
ORDER BY 1;Code language: PHP (php)
CTEs vs. Subqueries Best Practices:
- Use CTEs for multi-step logic, recursive operations, or datasets referenced multiple times within the same query.
- Use Subqueries strictly for lightweight, single-use scalar filters inside a
WHEREorHAVINGclause.
Tip 5: Define Metrics Once with SQL Views
- The Answer: Create centralized database views for core metrics (such as MRR, churn rate, or active users) so that all downstream dashboards, reports, and data consumers query a single, standardized source of truth.
- Why It Matters: Without centralized definitions, different reports often recalculate the same KPI using slightly variant logic. This creates metric drift, stakeholder confusion, and executive mistrust across your SQL Business Intelligence ecosystem.
SQL
CREATE VIEW vw_monthly_mrr AS
SELECT
    DATE_TRUNC('month', started_at) AS month,
    plan_name,
    SUM(monthly_price) AS mrr
FROM subscriptions
WHERE status = 'active'
  AND cancelled_at IS NULL
GROUP BY 1, 2;Code language: PHP (php)
Trade-offs and Maintenance:
- Abstraction Layer: While views isolate logic, they introduce a layer of abstraction that can obscure underlying performance bottlenecks.
- Governance: Treat database views like application code—ensure they are version-controlled, documented in a metadata repository, and regularly audited for schema changes.
Tip 6: Filter Early and Select Only Needed Columns
- The Answer: Apply
WHEREconditions before executing joins and explicitly declare required columns instead of usingSELECT *. In modern SQL Business Intelligence architectures, this design pattern minimizes memory usage and maximizes query performance. - Why It Matters: BI environments frequently house wide denormalized tables containing hundreds of columns and billions of rows. Scanning unneeded attributes wastes IOPS, degrades execution speed, and heavily drives up compute costs in cloud-native data warehouses like BigQuery and Snowflake.
SQL
-- Bad: Scans entire table structure across all columns, then filters
SELECT *
FROM large_events
WHERE event_date >= '2025-01-01';

-- Better: Filter early at the scan layer and select only necessary columns
SELECT
    event_type,
    user_id,
    event_date
FROM large_events
WHERE event_date >= '2025-01-01'
  AND event_type IN ('purchase', 'signup');Code language: JavaScript (javascript)
Performance Optimization Tip
Ensure that columns frequently utilized in your early
WHEREclauses andJOINconditions are indexed (or clustered/partitioned in columnar warehouses) to optimize database engine retrieval paths.
Tip 7: Choose the Right Join Type for Your BI Question
- The Answer: Default to an
INNER JOINfor strict relational intersections, and use aLEFT JOINexplicitly when your analytics requirement demands retaining all records from the primary entity (even those with zero matches). AvoidFULL OUTER JOINunless you are performing specialized data reconciliation tasks. - Why It Matters: Selecting the wrong join type silently corrupts row counts, skews ratio denominators, and introduces hidden biases into SQL Business Intelligence metrics. Stakeholders rely on clear baseline assumptions—your SQL code must mirror those business rules precisely.
SQL
-- INNER JOIN: Returns only customers who have placed at least one order
SELECT
    c.customer_id,
    COUNT(o.order_id) AS orders_count
FROM customers c
INNER JOIN orders o ON c.customer_id = o.customer_id
GROUP BY c.customer_id;

-- LEFT JOIN: Retains all customers, including those with zero orders (crucial for true adoption metrics)
SELECT
    c.customer_id,
    COUNT(o.order_id) AS orders_count
FROM customers c
LEFT JOIN orders o ON c.customer_id = o.customer_id
GROUP BY c.customer_id;
Code language: PHP (php)
Join Selection Checklist:
- Need unmatched rows from the primary entity? Use a
LEFT JOIN(orRIGHT JOIN).- Want strictly matched intersections? Use an
INNER JOIN.- Type Hygiene: Verify that join keys share identical data types across tables to prevent performance-degrading implicit type casting by the database engine.
Tip 8: Optimize Slow BI Queries with Indexes and Execution Plans
- The Answer: Add targeted indexes on columns frequently utilized in
WHERE,JOIN, andORDER BYclauses. Leverage database execution plans to inspect query cost and identify missing optimization paths. - Why It Matters: Slow-running queries stall executive dashboards, drain user patience, and drive up cloud compute costs. Mastering execution plan analysis and indexing strategies is essential for scaling performance across modern SQL Business Intelligence environments.
SQL
-- Example composite index tailored for high-frequency BI filters and joins
CREATE INDEX idx_orders_customer_date
ON orders (customer_id, order_date);
Practical Optimization Steps:
- Inspect Execution Plans: Run
EXPLAINorEXPLAIN ANALYZEto trace how the database engine resolves your query pipeline.- Target Sequential Scans: Look for full-table scans on large datasets where a well-placed index can convert high-cost lookups into efficient index seeks.
- Preserve SARGability: Avoid wrapping indexed columns in functions inside
WHEREclauses (e.g., avoidWHERE DATE(order_date) = ...), as this disables index utilization unless a dedicated functional index exists.- Index Trade-Offs: Excessive indexes degrade write performance (
INSERT,UPDATE,DELETE). Audit usage metrics regularly to prune unused indexes.
Tip 9: Make Dashboard-Ready Datasets, Not Raw Tables
- The Answer: Pre-aggregate, shape, and structure your data directly within SQL Business Intelligence layers before feeding it into downstream visualization tools like Power BI, Tableau, or Looker. Dashboards should consume clean, metric-ready tables or views rather than raw transactional data.
- Why It Matters: Offloading heavy calculations and data shaping to the database engine ensures performance, scalability, and maintainability. Performing complex aggregations and custom business rules inside BI visualization tools causes sluggish report rendering, hard-to-audit logic, and scattered metric definitions.
SQL
-- Create a pre-aggregated, dashboard-ready view for executive KPIs
CREATE VIEW vw_monthly_kpis AS
SELECT
    DATE_TRUNC('month', o.order_date) AS month,
    COUNT(DISTINCT o.customer_id) AS active_customers,
    COUNT(*) AS total_orders,
    SUM(o.amount) AS total_revenue,
    SUM(o.amount) / NULLIF(COUNT(*), 0) AS avg_order_value
FROM orders o
WHERE o.order_date >= '2024-01-01'
GROUP BY 1;Code language: PHP (php)
Design Tip
Dashboards consuming
vw_monthly_kpisrequire minimal in-tool calculations, allowing visualization platforms to focus entirely on rendering charts, applying UI filters, and organizing layouts effectively for stakeholders.
What is the difference between SQL for BI and Microsoft SQL Server BI?
SQL for BI refers to using standard SQL queries and relational concepts to prepare trusted metrics, aggregates, and datasets for any business intelligence ecosystem. Microsoft SQL Server BI, on the other hand, refers to a specific, proprietary enterprise stack—including SQL Server Reporting Services (SSRS), SQL Server Analysis Services (SSAS), and Power BI—that leverages SQL alongside specialized servers, multidimensional/tabular models, and reporting tools.
How do I stop duplicates when joining fact and dimension tables?
Prevent duplicate row inflation by pre-aggregating your fact tables to match the target grain before executing the join, or by utilizing window functions like ROW_NUMBER() to isolate a single, deterministic record per key. Never rely on DISTINCT as a blanket fix, as it only masks structural join errors rather than solving the underlying logic flaw.
Which is better for BI queries: CTEs or subqueries?
Common Table Expressions (CTEs) are superior for multi-step SQL Business Intelligence logic because they break complex transformations into named, sequential steps that drastically improve readability and maintainability. Save traditional subqueries strictly for lightweight, single-use scalar filters inside a WHERE or HAVING clause.
How can I make my BI queries faster?
Optimize your reporting performance by filtering datasets early, selecting only the columns you actually need, indexing high-frequency WHERE and JOIN columns, and reviewing database execution plans to eliminate full-table scans. For ultimate efficiency, pre-aggregate complex workloads directly into database views designed for downstream dashboards.
In Conclusion
Writing effective SQL Business Intelligence code is ultimately about bridging the gap between raw data and executive decision-making. By starting with clear business questions, understanding table grain to prevent row inflation, and treating queries as structured, modular pipelines, you ensure that your dashboards remain fast, scalable, and trusted across the organization.
Next Steps for Implementation:
- Audit Your Existing Queries: Review current dashboard data sources for unindexed joins, wildcard selections (
SELECT *), and unhandledNULLvalues. - Standardize Core Metrics: Move away from scattered script logic by implementing version-controlled SQL views for fundamental KPIs like MRR and active customer counts.
- Optimize Performance: Leverage execution plans to target slow-running queries and refine database indexes where it matters most.
Mastering these foundational habits transforms your SQL code from a basic reporting script into a resilient, high-performance asset for your data team.