Business Intelligence Specialist: Skills & How to Become One
Modern organizations depend on data-driven execution, yet turning raw numbers into strategic clarity remains a core operational bottleneck. A Business Intelligence Specialist bridges this gap by transforming complex datasets into actionable intelligence, empowering leadership to make high-impact decisions.
The day-to-day work of a Business Intelligence Specialist involves querying and preparing data, building scalable reports and dashboards, identifying operational trends, and communicating key insights to cross-functional stakeholders. While exact job titles vary across employers, U.S. occupational frameworks formally recognize Business Intelligence Specialist (or BI Specialist) as a reported title under the broader Business Intelligence Analysts occupation.
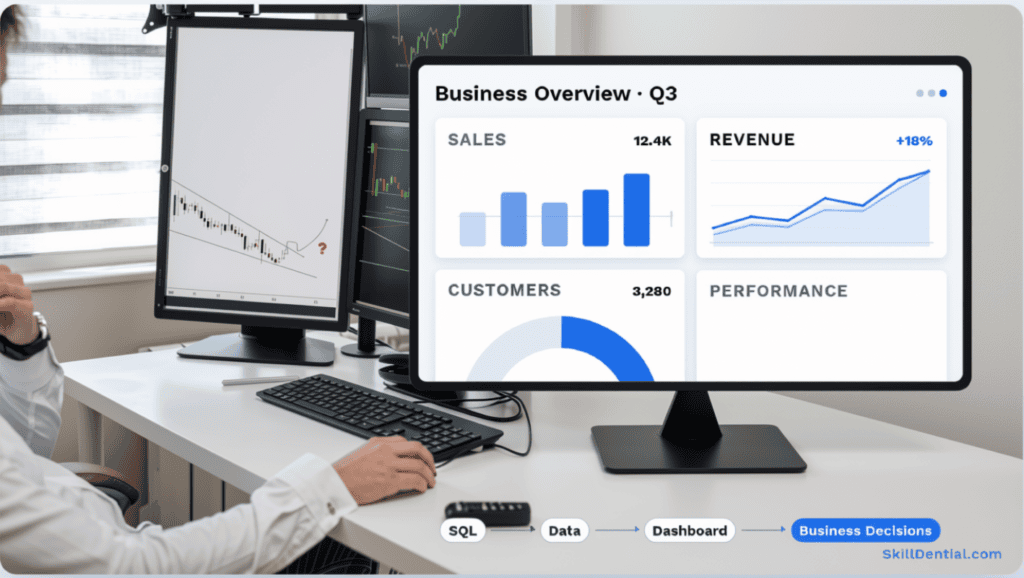
If you are considering a career in data and analytics, this guide details what a Business Intelligence Specialist does, the technical and business skills required, the tools worth mastering, how the role differs from related data careers, and a practical roadmap to become job-ready.
Defining the Role: What Is a Business Intelligence Specialist?
A Business Intelligence Specialist operates at the core of enterprise decision-making, translating raw, disconnected datasets into structured, actionable intelligence. Rather than operating purely as a technician or a general business strategist, a Business Intelligence Specialist owns the connective tissue between technical data architecture and commercial execution.
A Business Intelligence Specialist is a data professional who designs, builds, and maintains the systems and insights that organizations use to monitor performance, forecast trends, and execute operational strategy.
Business Intelligence (BI) encompasses the technical stack and analytical processes required to ingest, model, analyze, and visualize corporate data. For a Business Intelligence Specialist, the objective extends far beyond static reporting; the mandate is to establish a single source of truth that answers critical business questions with speed and precision.
Core Business Problems Solved by a BI Specialist
To understand the value of a Business Intelligence Specialist, consider a mid-market retail enterprise. Despite possessing millions of transactional rows, leadership often struggles to answer high-stakes operational questions, such as:
- Product Performance: Which specific product lines or SKUs are driving profit margins versus draining resources?
- Geographic Efficiency: Which regional locations or fulfillment centers are underperforming against cost baselines?
- Temporal Trends: How do seasonal fluctuations and macroeconomic shifts impact month-over-month revenue velocity?
- Customer Lifetime Value: Which distinct customer segments contribute the highest net-new revenue and retention?
- Goal Tracking: Are sales teams on track to hit quarterly key performance indicators (KPIs), or is pipeline velocity stalling?
- Operational Bottlenecks: Where are supply chain friction points or inventory delays occurring in real-time?
A Business Intelligence Specialist resolves these blind spots by connecting to disparate data sources, structuring robust relational models, running deep statistical queries, and packaging findings into intuitive, self-serve executive dashboards.
Business Intelligence Specialist vs. Business Intelligence Analyst
Are a Business Intelligence Specialist and a Business Intelligence Analyst the same role? Not always.
While organizations often use the titles interchangeably, the distinction typically comes down to technical depth versus business breadth. Official occupational frameworks, such as the U.S. O*NET database, list Business Intelligence Specialist (or BI Specialist) as a reported title underneath the broader occupation of Business Intelligence Analysts.
Depending on company size and data maturity, you may encounter several overlapping titles in the market:
- Business Intelligence Analyst: Often leans slightly heavier on commercial interpretation, stakeholder management, and translating existing reports into business strategy.
- Business Intelligence Specialist: Frequently implies a focused expertise in specific analytical frameworks, data governance, or high-complexity data workflows.
- BI Developer: Focuses primarily on backend data engineering, ETL pipelines, data warehouse architecture, and complex semantic layers.
- BI Consultant / Analytics Specialist: Client-facing or cross-departmental roles focused on auditing, building, and deploying bespoke BI solutions.
Strategic Hiring Advice
Because human resources departments and recruiters often mix these terms, job titles can be deceptive. A role titled Business Intelligence Analyst at a tech startup might require heavier data engineering than a role titled Business Intelligence Specialist at a traditional enterprise.
- Look Past the Title: Never restrict your job search to a single exact string.
- Audit the Responsibilities: Read the job description carefully to evaluate the technical weight (SQL, data modeling, ETL) versus the business weight (stakeholder presentation, KPI design).
Day-to-Day Responsibilities of a Business Intelligence Specialist
The daily routine of a Business Intelligence Specialist varies by company size, industry, and organizational data maturity. However, standardized occupational data (such as O*NET) and modern enterprise workflows consistently point to a core set of technical and strategic duties.
Here is what a Business Intelligence Specialist actually does on a day-to-day basis:
Gather and Connect Data
Before any insights can be generated, a Business Intelligence Specialist must establish reliable data pipelines. This involves ingesting raw data from a wide variety of disconnected corporate silos, which commonly include:
- Relational databases and data warehouses (PostgreSQL, Snowflake, BigQuery)
- Enterprise Resource Planning (ERP) and financial systems (NetSuite, SAP)
- Customer Relationship Management (CRM) platforms (Salesforce, HubSpot)
- Marketing automation and cloud services APIs
Clean and Prepare Data
Raw enterprise data is notoriously messy, siloed, and unstructured. A Business Intelligence Specialist spends a significant portion of time resolving data quality issues before analysis begins.
- Data Profiling & Hygiene: Identifying missing values, duplicate records, mismatched formatting, and incorrect data types.
- ETL Execution: Following standard data-preparation workflows—similar to Microsoft’s Power BI modeling frameworks—to ingest, transform, profile, and load (ETL) clean datasets into production-ready analytical models.
Query and Analyze Data
Writing clean, efficient code to interrogate databases is a non-negotiable requirement. A Business Intelligence Specialist relies heavily on SQL (Structured Query Language) to retrieve, filter, join, aggregate, and inspect relational data.
Analysis goes beyond simple arithmetic; it requires answering complex business questions such as:
- Which customer cohorts generated the highest net-new revenue over the past 12 months?
- Which product categories experienced the sharpest margin contraction quarter-over-quarter?
Build Reports and Dashboards
Once the data is modeled and analyzed, a Business Intelligence Specialist translates those findings into scalable, automated reports and interactive dashboards.
Effective dashboard engineering requires more than just dropping charts onto a screen. Aligning with industry best practices (such as Tableau’s design guidelines), a professional Business Intelligence Specialist builds dashboards that:
- Tailor visual hierarchy directly to the target audience (executives vs. operational managers).
- Provide immediate context for performance metrics and historical benchmarks.
- Highlight actionable insights while eliminating visual clutter.
Communicate Insights & Drive Strategy
A technically flawless data model has zero business value if stakeholders cannot interpret it. A top-tier Business Intelligence Specialist bridges the gap between raw data and executive decision-making.
Day-to-day communication requires answering five core questions for leadership:
- What happened? (Past performance and KPI tracking)
- Why did it happen? (Root-cause diagnostic analysis)
- What does the data indicate for the future? (Trends and forecasts)
- Which metrics require immediate intervention? (Operational flags)
- What strategic actions should the business take next?
Essential Business Intelligence Specialist Skills
You do not need to master every data tool on the market before entering the field. A more effective strategy is to build a balanced, foundational skill set across four core pillars: technical data handling, analytics engineering, business domain expertise, and executive communication.
SQL (Structured Query Language)
SQL remains the foundational technical skill for any Business Intelligence Specialist. Because the vast majority of enterprise data lives in relational databases and data warehouses, your ability to directly query, filter, and aggregate data dictates your speed and independence as an analyst.
Rather than trying to memorize every syntax variation, a proficient Business Intelligence Specialist focuses on mastering the core operations required to answer complex business questions:
- Data Retrieval & Filtering:
SELECT,WHERE, andORDER BYclauses to isolate specific data subsets. - Data Aggregation & Grouping:
GROUP BYand aggregate functions (SUM,AVG,COUNT) to calculate metrics like total revenue or average order value. - Table Relational Joins: Inner, left, and right
JOINoperations to stitch together disconnected data from sales, customer, and product tables. - Advanced Query Logic: Subqueries, Common Table Expressions (CTEs), and window functions (
ROW_NUMBER(),RANK(),LEAD/LAG) to handle running totals, period-over-period comparisons, and ranking cohorts. - Data Formatting: Date and string manipulation functions to clean temporal and textual data on the fly.
Industry Demand
SQL is not just a nice-to-have skill—it is an absolute baseline requirement. According to O*NET employer-posting data, SQL is the single most frequently requested software skill for the Business Intelligence Analysts occupation, appearing in 35% of all tracked U.S. job postings. Mastering SQL ensures you can bypass data engineering bottlenecks and pull your own insights directly from the source.
Data Visualization & Dashboard Design
Building dashboards is often the most visible part of a Business Intelligence Specialist’s job, but aesthetic appeal is secondary to functional clarity. The primary objective of data visualization is to reduce cognitive load, making complex operational trends instantly understandable and actionable for stakeholders.
A competent Business Intelligence Specialist masters the following visualization principles:
- Appropriate Chart Selection: Knowing precisely when to use time-series line charts, categorical bar charts, scatter plots, or distribution curves—and strictly avoiding confusing visual formats like 3D charts or overloaded pie charts.
- Executive Metrics & KPI Cards: Designing high-level summary cards that display top-line metrics alongside period-over-period growth or target variance.
- Visual Hierarchy & Color Theory: Using color intentionally to draw immediate attention to anomalies, thresholds, or critical alerts, rather than decorating a dashboard with distracting color palettes.
- Interactivity & Filtering: Implementing cascading filters, drill-downs, and cross-highlighting so end-users can slice and dice data without breaking the underlying model.
- Dashboard Layout & UX: Structuring dashboard real estate logically—putting high-level KPIs at the top left, supporting trends in the middle, and granular data tables at the bottom.
- Data Storytelling & Accessibility: Structuring metrics into a logical narrative flow while ensuring contrast, font sizing, and formatting remain accessible to all users.
Business Intelligence Platforms (Power BI & Tableau)
You do not need to master every analytics software on the market to land a job. Trying to learn every competing platform leads to shallow expertise; instead, a strategic Business Intelligence Specialist focuses on mastering one industry-standard tool and understanding its underlying semantic framework.
Core BI Platforms to Target
- Microsoft Power BI: Heavily integrated with the Microsoft ecosystem (Excel, Azure, SQL Server), making it the dominant choice for enterprise environments.
- Tableau: Renowned for advanced visual flexibility, deep data exploration, and strong market share across tech-forward organizations.
- Looker (Google Cloud) & Qlik: Increasingly popular in cloud-native or specialized data stacks.
Technical Benchmark: The Power BI Framework
To understand what platform competency actually requires, look at enterprise benchmarks like Microsoft’s Power BI Data Analyst certification framework. A qualified Business Intelligence Specialist must be capable of handling the complete platform lifecycle:
- Data Preparation: Connecting to cloud and on-premises data sources, shaping tables, and establishing clean dataflows.
- Data Modeling: Designing star schemas, building relationship cardinalities, and writing DAX (Data Analysis Expressions) calculated columns and measures.
- Visualization & Analysis: Building interactive, responsive reports optimized for both desktop and mobile executive consumption.
- Governance & Administration: Managing row-level security (RLS), workspace permissions, and scheduled dataset refreshes.
Industry Demand
Official O*NET U.S. labor data highlights Microsoft Power BI and Tableau as the premier platform competencies requested by employers hiring for the Business Intelligence Analysts occupation. Pick one—ideally Power BI if targeting corporate enterprises or Tableau if targeting fast-growing tech companies—and build a portfolio project around it.
Data Modeling & Semantic Design
Raw data tables are rarely structured for immediate analytical querying. If you attempt to stuff every customer record, product detail, geographic location, and financial transaction into a single massive spreadsheet, your dashboards will slow to a crawl and your metrics will break.
Data modeling is the process of structuring enterprise data into a clean semantic layer so that relationships, filters, and calculations remain fast, accurate, and scalable. A skilled Business Intelligence Specialist knows how to move beyond flat tables and architect robust relational structures.
Core Data Modeling Concepts to Master
- Fact Tables: Tables that store quantitative, transactional metrics (e.g., sales revenue, quantities sold, timestamps) that change frequently and aggregate upwards.
- Dimension Tables: Tables that store descriptive attributes about business entities (e.g., customer names, product categories, store locations, calendar dates).
- Star Schema Design: The industry-standard modeling approach that connects a central fact table outward to multiple dimension tables, optimizing query performance and readability.
- Keys & Relationships: Managing primary keys (unique identifiers for rows in a dimension table) and foreign keys (references linking transactional rows to those dimensions).
- Cardinality: Understanding relationship constraints, such as one-to-many (1:*) or many-to-many (*:*) relationships, to prevent unintended cross-filtering errors.
- Calculations & Measures: Writing efficient calculation logic (such as DAX in Power BI or calculated fields in Tableau) to compute dynamic metrics on the fly without duplicating underlying database storage.
Data Preparation & ETL
Data preparation is rarely glamorous, but it dictates the reliability of every metric downstream. The industry adage garbage in, garbage out is an absolute reality in analytics; if your data ingestion is flawed, your executive dashboards will be useless.
A proficient Business Intelligence Specialist must master the foundational mechanics of Extract, Transform, Load (ETL) workflows to clean, normalize, and shape raw data before it ever reaches a visualization layer.
Core Data Preparation Competencies to Master
- Handling Missing & Null Values: Implementing strategies to impute, flag, or safely filter out missing data points without skewing statistical results.
- Deduplication: Identifying and stripping out redundant or duplicate records that artificially inflate volume metrics like revenue or user counts.
- Format Standardization: Harmonizing disparate data formats (e.g., converting mixed date strings into a unified ISO standard or standardizing currency codes and casing).
- Type Casting & Data Structuring: Ensuring correct data types are applied (integers, floats, booleans, strings, datetimes) to prevent calculation errors and optimize query performance.
- Dataset Merging & Appending: Safely joining relational tables or appending historical datasets together using tools like SQL joins, Python pandas, or visual ETL builders.
- Transformation & Validation: Using tools like Power Query (widely used in the Microsoft ecosystem) to automate repeatable transformation steps, apply conditional logic, and validate output accuracy against baseline figures.
DAX (Data Analysis Expressions) or Equivalent Calculation Engines
If your primary BI platform is Microsoft Power BI, mastering DAX (Data Analysis Expressions) is non-negotiable. While SQL extracts data from a database and data modeling structures it, DAX is the formula language that breathes life into your semantic model by calculating dynamic metrics on the fly.
Microsoft defines DAX as a library of functions, operators, and constants used to build custom calculated columns and dynamic measures. Without DAX, your reports are limited to static numbers; with DAX, you can build responsive, context-aware analytics.
Core DAX Concepts to Master
- Calculated Columns vs. Measures: Knowing when to compute values row-by-row during data refresh (calculated columns) versus computing metrics dynamically based on user filter selections (measures).
- Aggregation & Basic Arithmetic: Writing core expressions for sums, averages, counts, and ratios (e.g.,
SUMX,AVERAGE). - Time Intelligence Functions: Calculating complex temporal comparisons like Year-to-Date (
TOTALYTD), Month-over-Month growth (SAMEPERIODLASTYEAR), and running totals. - Context Manipulation: Understanding row context versus filter context, and mastering functions like
CALCULATE()to override or modify standard filter behaviors.
Pragmatic Learning Approach
You do not need to memorize advanced, multi-table DAX formulas on day one. Start by building basic explicit measures for core KPIs, and gradually tackle advanced filtering and time intelligence as your data modeling confidence grows. If you use an alternative ecosystem like Tableau, focus equivalent energy on mastering Tableau Calculated Fields and table calculations.
Microsoft Excel (Advanced Spreadsheet Proficiency)
Despite the prevalence of advanced cloud data warehouses and enterprise BI suites, Microsoft Excel remains a foundational tool for a Business Intelligence Specialist. Even within high-maturity data organizations, Excel is the universal sandbox for ad-hoc validation, rapid prototyping, and executive quick-takes.
A qualified Business Intelligence Specialist should move beyond basic spreadsheet entry and master advanced analytical capabilities in Excel:
- Core Formulas & Lookups: Expert command of dynamic lookup and reference functions (
XLOOKUP,INDEX/MATCH) to merge disparate data arrays quickly. - PivotTables & PivotCharts: Building multidimensional summaries and cross-tabulations to test hypotheses before committing them to a production BI pipeline.
- Conditional Logic & Data Cleaning: Writing nested logical statements (
IF,IFS,AND,OR) and leveraging text-to-columns, Flash Fill, and Power Query in Excel to scrub messy datasets. - Statistical Analysis: Utilizing built-in analysis tools (such as correlation, regression, and descriptive statistics) for preliminary exploratory data analysis (EDA).
Industry Demand
While organizations often graduate from Excel for enterprise reporting, employer data confirms its enduring utility. Official O*NET job-posting metrics for the Business Intelligence Analysts occupation consistently list Microsoft Excel alongside SQL and Power BI as a core software competency expected by hiring managers.
Business Domain Knowledge & Commercial Acumen
Technical mastery of SQL, data modeling, and visualization platforms is only half the battle. One of the most common reasons junior analytics projects fail is a lack of business domain knowledge—the ability to connect a technical data query to a real-world commercial outcome.
A top-tier Business Intelligence Specialist understands that different departments speak entirely different operational languages. While the underlying tech stack remains identical, the core metrics and strategic priorities shift drastically depending on who you are supporting:
- Marketing Analytics: Focuses heavily on customer acquisition costs (CAC), conversion funnel efficiency, campaign ROI, channel attribution, and Customer Lifetime Value (LTV).
- Finance & Executive Leadership: Prioritizes top-line revenue growth, gross margins, EBITDA, operating expenses, cash flow velocity, and budget variance.
- Supply Chain & Operations: Tracks inventory turnover, fulfillment lead times, stock-out rates, logistics costs, and supplier performance SLAs.
Why This Matters
Tools and queries provide the how, but business context provides the why. When you understand the operational drivers of your stakeholders, you stop building generic, cluttered dashboards and start engineering targeted solutions that directly impact company performance and profitability.
Executive Communication & Presentation
You can write flawless SQL queries, build pristine star schemas, and design gorgeous dashboards, but if you cannot effectively communicate your findings to leadership, your technical work will stall in a vacuum. A Business Intelligence Specialist must act as a bridge between complex data engineering and executive decision-making.
Mastering communication requires developing several key professional habits:
- Translating Technical Complexity: Stripping away jargon to explain database logic, statistical anomalies, or pipeline limitations in clear, plain business language.
- Asking High-Leverage Questions: Pushing back on ambiguous stakeholder requests by asking clarifying questions to uncover the actual business problem needing resolution.
- Structuring Concise Summaries: Delivering executive-ready readouts that lead with the bottom line (the insight), follow with supporting evidence (the data), and conclude with recommended action items.
- Separating Facts from Assumptions: Clearly distinguishing between empirical patterns found in historical data and speculative predictions about future market behavior.
- Transparently Communicating Limitations: Explicitly calling out data gaps, missing variables, or sample size constraints so decision-makers understand the risk profile of the insights they are acting upon.
The Modern Business Intelligence Specialist Tool Stack
There is no single mandatory technology stack that applies to every organization, as enterprise data maturity varies widely. However, trying to learn every available software package leads to shallow competence.
A practical, industry-aligned beginner-to-intermediate stack focuses on mastering an integrated suite of tools that covers the entire data lifecycle:
| Skill Area | Beginner-to-Core Technology | Purpose & Application |
| Spreadsheet Analysis | Microsoft Excel | Ad-hoc data validation, rapid prototyping, and quick exploratory analysis. |
| Database Querying | SQL (PostgreSQL, Snowflake, or BigQuery) | Extracting, filtering, and joining data directly from relational databases. |
| Data Preparation | Power Query / Python (Pandas) | Cleaning, shaping, transforming, and automating ETL workflows. |
| BI Platform | Microsoft Power BI or Tableau | Building interactive, scalable enterprise dashboards and reports. |
| Data Modeling | Power BI Semantic Models / SQL | Structuring star schemas, defining relationships, and setting table cardinality. |
| Calculations | DAX (Power BI) or Calculated Fields | Writing dynamic measures, calculated columns, and time-intelligence formulas. |
| Visualization | Power BI / Tableau Native Charts | Translating complex metrics into clear visual hierarchies and KPI cards. |
| Portfolio & Version Control | GitHub / Personal Website / Tableau Public | Showcasing end-to-end analytical projects to prospective employers. |
| Documentation & Readouts | Markdown / Executive Decks / Reports | Communicating methodology, insights, and data limitations clearly. |
Strategic Implementation Advice
You do not need to master all of these technologies simultaneously. A progressive, project-driven approach works best: start with Excel and SQL to master data foundations, layer on Power Query for preparation, and finish by integrating a visualization platform like Power BI or Tableau to build your first portfolio-ready dashboard.
Business Intelligence Specialist vs. Data Analyst
The lines between a Business Intelligence Specialist and a Data Analyst blur constantly. Because job titles vary wildly across the tech and enterprise landscapes, many organizations use them interchangeably.
However, looking closely at day-to-day responsibilities, scope, and ownership reveals distinct operational differences:
| Dimension | Business Intelligence Specialist | Data Analyst |
| Primary Focus | Heavy focus on business reporting, metric standardization, and operational decision support. | Broader mandate covering exploratory, operational, marketing, product, or predictive analysis. |
| Tool Stack & Infrastructure | Frequently works with enterprise dashboards, BI platforms (Power BI, Tableau), and semantic data models. | Often utilizes spreadsheets, SQL, statistical programming languages (Python/R), and BI tools. |
| Environment Ownership | Commonly builds, maintains, and governs enterprise BI reports, dashboards, and data models. | Produces ad-hoc analyses and reports without necessarily owning or maintaining the broader BI architecture. |
| Stakeholder Interaction | Works closely with finance, executive, and operational leaders to track core Key Performance Indicators (KPIs). | Collaborates with cross-functional product, marketing, or engineering teams to answer specific business questions. |
Why the Distinction is Fluid
Because human resources departments rarely agree on strict definitions, job titles can be deceptive. A company hiring a Data Analyst might expect you to build heavy enterprise data models, while a company hiring a Business Intelligence Specialist might simply want a spreadsheet expert to pull weekly sales numbers.
- Read the Job Description: Always look past the job title and evaluate the required technical stack (e.g., SQL, data modeling, ETL) versus the analytical scope (e.g., ad-hoc queries vs. dashboard governance).
- Industry Benchmarks: For instance, Microsoft’s official Power BI Data Analyst framework spans stakeholder collaboration, data preparation, modeling, visualization, and workspace administration—duties that heavily overlap with modern Business Intelligence Specialist work.
When searching for your next career move, filter by required skills rather than job titles alone.
Business Intelligence Specialist vs. Data Engineer
While a Business Intelligence Specialist and a Data Engineer frequently collaborate within the same data architecture ecosystem, they solve fundamentally different problems and operate at distinct layers of the data stack.
Understanding where one role ends and the other begins is crucial for clarifying your day-to-day responsibilities and technical expectations.
| Dimension | Business Intelligence Specialist | Data Engineer |
| Primary Focus | Translating structured data into business insights, dashboards, reports, and decision-support systems. | Building, scaling, and maintaining the backend pipelines, data warehouses, and storage infrastructure. |
| Core Deliverables | Executive dashboards, semantic data models, KPI scorecards, and strategic business readouts. | ETL/ELT data pipelines, data lake architectures, database optimization, and data governance frameworks. |
| Primary Tool Stack | SQL, Power BI, Tableau, Excel, DAX, and semantic modeling tools. | Python, Scala, SQL, Airflow, Spark, Snowflake, BigQuery, and cloud data infrastructure (AWS/GCP/Azure). |
| Stakeholder Interaction | Works directly with business leaders (Finance, Marketing, Sales, Executives) to align metrics with strategy. | Works primarily with downstream data consumers, analysts, and software engineers to ensure data availability. |
The Data Pipeline Workflow
To visualize how these roles interact, trace a piece of corporate data from its origin to executive decision-making:
Plaintext
[Data Sources: CRM, ERP, APIs]
       ↓
[Data Engineering: Pipelines, Warehouses, Storage]  ← (Data Engineer Domain)
       ↓
[Prepared Data & Semantic Models]
       ↓
[BI Analysis: SQL, DAX, Modeling]                   ← (Business Intelligence Specialist Domain)
       ↓
[Dashboards, Reports & Insights]
       ↓
[Business Decisions & Strategy]
Code language: CSS (css)
Where the Lines Blur
In smaller companies, startups, or lean analytics teams, these roles often merge. A Business Intelligence Specialist working in a resource-constrained environment may be expected to write their own data pipelines, manage cloud data warehouse tables, or handle basic database administration alongside dashboard creation.
Conversely, in mature enterprise environments, the boundaries are strictly drawn: data engineers hand off clean, reliable data models to the Business Intelligence Specialist, allowing them to focus entirely on business logic, analytics engineering, and executive storytelling.
Do You Need a Degree to Become a Business Intelligence Specialist?
A university degree can be a helpful foundation, but it is not a strict prerequisite for breaking into the field. Employer requirements for a Business Intelligence Specialist vary wildly depending on industry maturity, company size, and geographic location.
Official U.S. labor frameworks (such as ONET) place the broader Business Intelligence Analysts occupation in Job Zone Four, designating it as an area that requires considerable preparation. According to ONET data, while many positions in this tier traditionally look for a four-year bachelor’s degree, a significant portion of employers prioritize practical capability over paper credentials.
Relevant Academic Backgrounds
When employers do look for formal education, they typically source candidates from quantitative, technical, or commercial disciplines, including:
- Technical & Quantitative: Computer Science, Information Systems, Data Analytics, Statistics, Mathematics, and Engineering.
- Commercial & Financial: Economics, Finance, Accounting, and General Business Administration.
The Power of Domain-Specific Career Changers
If you are transitioning into the field from a non-technical background—such as finance, marketing, operations, or customer success—you possess a hidden advantage that a fresh computer science graduate often lacks: deep business domain knowledge.
Example
Consider a corporate accountant who decides to learn SQL, data modeling, and Power BI. By combining their rigorous understanding of financial statements, cash flow mechanics, and budget variance with modern BI capabilities, they immediately position themselves as a high-value Business Intelligence Specialist who can talk strategy with executive leadership.
The Ultimate Hiring Criterion
Hiring managers in the data space are ultimately risk-mitigators. They care far less about the title on your diploma and far more about proof of competence.
When evaluating candidates, the defining question is rarely:
“Do you have a four-year data degree?”
Instead, the hiring manager is asking:
“Can you demonstrate that you can connect to messy data sources, build robust models, and use BI tools to solve real-world business problems?”
If you can prove your technical capability through a strong portfolio of projects, practical SQL proficiency, and clear dashboard design, your background—degree or no degree—becomes secondary to what you can actually deliver.
How to Become a Business Intelligence Specialist
While there is no single mandatory path to breaking into the field, the following structured roadmap provides beginners with a practical, high-leverage sequence to build competence and launch a career as a Business Intelligence Specialist.
Step 1: Learn Data and Business Fundamentals
Before diving into complex analytics software or writing advanced code, you must build a firm grasp of foundational data and business concepts. Without this baseline, technical tools become useless.
Focus on mastering these core fundamentals early:
- Data Structures: Understand basic data types (integers, strings, booleans, dates) and how individual records map to rows and columns within relational tables.
- Analytical Reasoning: Learn how to look at a raw dataset, identify what each column represents, and map out the specific business questions the data can answer.
- Core Math & Statistics: Build comfort with percentages, ratios, growth rates, averages, medians, and variance.
- Business Metrics & KPIs: Learn how organizations measure operational health, such as conversion rates, customer retention, and revenue velocity.
Step 2: Master Microsoft Excel for Foundational Analysis
Before tackling advanced data warehouses or enterprise BI suites, use Microsoft Excel as your sandbox to learn how structured data behaves. Avoid the trap of passively watching video tutorials—the fastest way to build competence is through hands-on practice with real-world datasets.
Practical Project Exercise
Download a raw transactional dataset (such as a retail sales CSV) and practice answering core business questions using standard spreadsheet mechanics:
- Total Revenue: Calculate aggregate top-line revenue using sum formulas or pivot tables.
- Average Order Value (AOV): Compute baseline transaction sizing.
- Temporal Trends: Aggregate sales performance month-over-month.
- Categorical Breakdowns: Slice performance by specific product lines and geographic regions.
- Comparative Growth: Calculate year-over-year (YoY) percentage changes to measure business momentum.
Mastering these foundational spreadsheet operations ensures you understand how data aggregates before you write your first database query.
Step 3: Learn SQL (Structured Query Language)
Once you understand how to manipulate structured data in spreadsheets, transition directly into database querying. Because the vast majority of enterprise data lives in relational databases, SQL is your primary gateway to accessing raw information.
Do not stop at basic syntax tutorials. Your objective is to use SQL to solve real business problems. Progress through a structured learning curve:
- Retrieval & Filtering: Master
SELECT,WHERE,ORDER BY, andLIMITto isolate specific records. - Aggregation: Use
GROUP BYalongside aggregate functions (SUM,AVG,COUNT,MAX) to calculate top-line metrics. - Relational Joins: Learn inner, left, right, and full outer
JOINoperations to merge disconnected data tables (e.g., combining customer details with order transactions). - Advanced Logic: Build proficiency with Common Table Expressions (CTEs), subqueries, and window functions (
ROW_NUMBER(),RANK(),LAG/LEAD) to handle complex calculations and period-over-period tracking.
Step 4: Choose and Master One BI Platform
Once you have a firm grip on SQL and spreadsheet analysis, select a single industry-standard BI platform—such as Microsoft Power BI or Tableau—and commit to mastering it. Avoid the temptation to bounce between competing tools; deep competence in one platform is far more valuable to a hiring manager than shallow familiarity with three.
If you choose the Microsoft Power BI pathway, align your learning with the official Power BI Data Analyst framework, which encompasses four operational pillars:
- Prepare the Data: Ingesting and transforming raw sources using Power Query.
- Model the Data: Structuring star schemas, defining relationships, and writing calculations using DAX (Data Analysis Expressions).
- Visualize and Analyze the Data: Designing responsive, user-centric executive dashboards and interactive reports.
- Manage and Secure Power BI: Handling workspace permissions, scheduled dataset refreshes, and Row-Level Security (RLS).
Step 5: Learn Data Modeling & Semantic Design
A common beginner mistake is jumping straight from SQL querying into dashboard design, ending up with flat, messy data structures that break when scaled. Before you build a single chart, learn how your data must be modeled to ensure calculations remain accurate and performant.
Focus your practice on core semantic architecture:
- Star Schemas: Learn how to separate quantitative transactions into fact tables and descriptive attributes into dimension tables.
- Relationship Cardinality: Practice establishing correct table relationships (such as one-to-many) and managing primary and foreign keys.
- Semantic Integrity: Structure your models so that filters propagate cleanly across tables, preventing calculation errors and ensuring your metrics aggregate correctly.
Step 6: Build Practical Portfolio Projects
This is where you separate yourself from other candidates. Hiring managers rarely care about certificate lists; they care about proof of work. Build end-to-end projects that solve realistic business problems using public datasets.
Structure your portfolio around three distinct domains:
- Project 1: Sales & Revenue Dashboard
- Datasets: Orders, Products, Customers, Dates.
- Business Questions: What are total top-line sales? Which SKUs generate the highest margin? Which geographic regions outperform? How does performance trend month-over-month?
- Project 2: Customer Segmentation & Retention
- Datasets: Customer transaction history, engagement logs.
- Business Questions: Which customer cohorts drive the highest lifetime value (LTV)? How frequently do buyers reorder? Which segments exhibit declining activity or churn risk?
- Project 3: Operations & Logistics Dashboard
- Datasets: Supply chain logs, fulfillment timestamps, regional hubs.
- Business Questions: Which locations experience the heaviest workload? Where are bottlenecks or fulfillment delays occurring? Which operational KPIs are missing target SLAs?
Portfolio Best Practice
Host your code on GitHub, publish your dashboards on Tableau Public or Power BI Service, and clearly label these as personal portfolio projects so recruiters instantly see your applied capability.
Step 7: Document Your Projects & Explain Your Reasoning
A finished dashboard or raw SQL script alone does not prove strong analytical thinking. To a hiring manager, a visual interface without context looks like a black box.
For every project in your portfolio, write a clear, concise documentation case study that explains the analytical journey behind the work:
- The Business Problem: Define the commercial objective and the specific operational questions leadership needed answered.
- The Dataset: Outline your data sources, table structures, and volume of records.
- The Data-Cleaning Process: Detail how you handled missing values, resolved duplicates, standardized formats, and built your ETL/Power Query workflow.
- The Data Model: Explain your star schema design, fact-to-dimension relationships, cardinality, and key calculation logic (DAX or SQL queries).
- The Analysis & Dashboard: Showcase screenshots or interactive links to the final report, highlighting how visual hierarchy and KPI cards were tailored to the audience.
- Key Findings: Summarize the primary empirical insights uncovered by the data.
- Limitations: Transparently call out missing variables, sample constraints, or potential data biases.
- Potential Next Steps: Outline what secondary analysis or advanced modeling you would pursue given more time.
Documenting your reasoning transforms a basic technical exercise into proof of senior-level commercial communication.
Step 8: Build a High-Signal Portfolio
When hiring managers evaluate a candidate for a Business Intelligence Specialist role, they care infinitely more about applied proof of work than a laundry list of online certificates. Your portfolio is your primary conversion tool.
Instead of filling your GitHub or personal website with dozens of unfinished exercises or trivial tutorials, focus on three to five exceptional, end-to-end projects.
What Every Strong Portfolio Project Must Demonstrate
For each project in your portfolio, provide concrete, visible evidence across six critical competencies:
- SQL Mastery: Display clean, commented SQL queries showing joins, CTEs, and aggregation logic used to extract the raw data.
- Data Preparation: Highlight how you cleaned messy data, handled null values, and built your ETL or Power Query pipeline.
- Data Modeling: Include an entity-relationship diagram (ERD) or schema graphic proving your star-schema design and table cardinality.
- Visualization Execution: Embed interactive links (e.g., Tableau Public, Power BI Service) or crisp screenshots of your executive dashboards.
- Business Reasoning: Frame every project around a real-world commercial problem rather than just a technical exercise.
- Executive Communication: Include a short, structured written case study explaining your methodology, key empirical findings, limitations, and strategic recommendations.
By curating a tight collection of deep, well-documented projects, you prove to hiring managers that you can step into an organization on day one and turn complex data into immediate commercial clarity.
Step 9: Master the Interview: Learn to Discuss Your Work
Technical brilliance on a resume means very little if you cannot articulate your decisions in a live interview. Hiring managers and cross-functional leaders want to test whether you think like a strategic partner or merely execute software commands.
Prepare to defend your portfolio projects and analytical choices using plain business language, moving far beyond technical jargon. Anticipate core interview questions designed to test your commercial reasoning:
- “Why did you choose this specific KPI over alternatives?” (Tests your understanding of business drivers and operational impact).
- “Why did you use this particular chart to visualize the trend?” (Tests your command of cognitive load, visual hierarchy, and dashboard design principles).
- “What would you investigate first if this metric suddenly dropped by 20%?” (Tests your diagnostic thinking, root-cause analysis, and problem-solving methodology).
Being able to answer these questions with confidence proves you can bridge the gap between complex data infrastructure and high-stakes executive decision-making.
Step 10: Cast a Wide Net—Target Related Job Titles
Because human resources departments and recruiters use inconsistent nomenclature, searching exclusively for the exact title Business Intelligence Specialist will severely limit your job search. Many organizations use alternative titles to describe identical or highly overlapping technical responsibilities.
When you are ready to enter the job market, expand your search across a broader range of high-relevance job titles:
- Business Intelligence Analyst / BI Analyst: The most common direct equivalent, focusing heavily on reporting, dashboard design, and stakeholder support.
- Reporting Analyst / Reporting Specialist: Roles focused heavily on metric tracking, automated reporting infrastructure, and performance scorecards.
- Data Analyst: A broad title that often incorporates SQL querying, dashboarding, and ad-hoc business analysis.
- Business Analyst: A commercial-facing role that blends data analysis with operational process mapping and requirements gathering (verify the technical requirements in the job description).
- BI Consultant / Analytics Specialist: Client-facing roles common in agency or consulting environments, requiring strong stakeholder communication alongside technical BI execution.
- Junior BI Analyst: An ideal entry point if you are transitioning careers or breaking into the field with a portfolio of personal projects.
Execution Strategy
Do not let a job title deter you from applying. Always read the core job description and required technical stack (SQL, data modeling, visualization tools) rather than relying on the title alone to determine if a role matches your skill set.
Do You Need a Business Intelligence Certification?
A professional certification can validate your structured learning and signal baseline competence to recruiters, but it is never a substitute for practical ability.
Industry standards like the Microsoft Certified: Power BI Data Analyst Associate certification prove that you understand how to prepare, model, visualize, and analyze data using Power BI, as well as manage and secure the platform. Official U.S. occupational frameworks (such as O*NET) also recognize this specific credential among top certifications associated with the Business Intelligence Analysts occupation.
The Correct Career Sequence
If you choose to pursue credentials, timing and sequence matter. Avoid the trap of collecting certificates in hopes that they will magically act as a proxy for actual work experience.
Instead, follow a high-leverage order of operations:
Learn $\rightarrow$ Practise $\rightarrow$ Build Projects $\rightarrow$ Document Projects $\rightarrow$ Consider Certification
While a recognized certification will strengthen your resume, hiring managers ultimately evaluate your technical execution, portfolio depth, communication skills, and proven ability to solve real-world business problems. Let your project portfolio do the heavy lifting, and use certifications as a strategic capstone rather than your primary entry ticket.
How Long Does It Take to Become a Business Intelligence Specialist?
There is no universal timeline for breaking into the field. The duration depends heavily on your starting point: a professional transitioning from finance, marketing, operations, or advanced Excel reporting will ramp up significantly faster than someone starting from absolute zero.
However, moving through a structured, high-leverage learning sequence typically spans 3 to 9 months of consistent, focused effort (roughly 10 to 15 hours per week):
| Stage | Main Focus Area | Estimated Timeline | Core Objective |
| Stage 1 | Foundation | Weeks 1–4 | Excel, data concepts, basic statistics, and core business metrics. |
| Stage 2 | Core Analytics | Weeks 5–10 | SQL querying, relational joins, aggregation, and analytical thinking. |
| Stage 3 | BI Platforms | Weeks 11–16 | Mastering Microsoft Power BI or Tableau and native visualization principles. |
| Stage 4 | Data Modeling | Weeks 17–20 | Star schemas, dimensions, fact tables, cardinality, and DAX/calculations. |
| Stage 5 | Portfolio Projects | Weeks 21–26 | Building 3 to 5 realistic, end-to-end business dashboards and datasets. |
| Stage 6 | Documentation & Search | Weeks 27+ | Writing case studies, optimizing your resume, and interviewing for roles. |
The Real Milestone: Job Readiness
Do not measure your progress by a calendar date or the number of months studied. The only metric that matters is job readiness—can you open a messy dataset, clean it, model it, build an executive dashboard, and articulate your business reasoning to a hiring manager with absolute confidence? Focus on output, not duration.
Common Mistakes Beginners Make
When breaking into the field, many aspiring analysts fall into predictable traps that slow down their progress and dilute their market value. Avoid these critical mistakes on your journey to becoming a Business Intelligence Specialist:
- Learning Too Many Tools at Once: Trying to master Power BI, Tableau, Python, R, SQL, Snowflake, and AWS simultaneously leads to shallow, fragmented knowledge. Pick a lean, high-leverage stack (e.g., SQL + Power BI + Excel) and master it before expanding.
- Focusing Solely on Dashboards: A visually striking interface means nothing if the underlying metrics are flawed. Prioritize data modeling, metric definitions, and the commercial business question over aesthetic window dressing.
- Ignoring Data Quality: Building an executive dashboard on top of dirty, unverified data produces misleading insights. Always profile, clean, and validate your data before loading it into your semantic model.
- Treating Every Metric as Meaningful: Adding dozens of charts and KPIs clutters the interface and increases cognitive load. A high-value BI report isolates the critical drivers that directly inform the decision at hand.
- Building Portfolios Without Business Context: A generic project titled “Sales Dashboard” tells hiring managers nothing. Frame every project around a specific business problem—such as “Which product categories are driving the decline in monthly revenue?”—to showcase true analytical reasoning.
- Confusing Certification with Competence: Collecting online badges does not equal practical ability. Use certifications as a strategic capstone, but let a documented, end-to-end project portfolio do the heavy lifting in interviews.
What Does a Typical Business Intelligence Career Path Look Like?
Career progression in analytics is rarely a rigid corporate ladder. The trajectory for a Business Intelligence Specialist varies depending on company size, industry, and whether you prefer deep technical specialization or commercial leadership.
A standard, highly viable career pathway looks like this:
$$\text{Entry-Level Reporting / Data Role}$$
$$\downarrow$$
$$\text{Data Analyst / BI Analyst}$$
$$\downarrow$$
$$\text{Business Intelligence Specialist / Senior BI Analyst}$$
$$\downarrow$$
$$\text{BI Consultant / Analytics Lead}$$
$$\downarrow$$
$$\text{BI Manager / Analytics Manager / Head of Analytics}$$
Key Career Trajectories & Specializations
As you advance beyond your foundational years as a Business Intelligence Specialist, your career can branch out in several strategic directions:
- The Technical Specialist Track: Moving deeper into database architecture, advanced data engineering, and semantic modeling (transitioning into roles like Senior BI Developer or Analytics Engineer).
- The Advisory & Consulting Track: Leveraging your expertise across multiple clients or enterprise departments as an independent BI Consultant, Solutions Architect, or Analytics Lead.
- The Management Track: Transitioning away from hands-on dashboard building and SQL writing to manage teams of analysts, oversee enterprise data governance, and align analytics budgets with executive strategy (BI Manager, Director of Business Intelligence).
- The Domain Expert Track: Combining your BI capabilities with deep industry knowledge in finance, supply chain, or healthcare to become a high-value Business Analytics Manager or Strategy Lead.
Your ultimate destination will be shaped by your specific technical competence, business acumen, communication skills, and personal career interests.
Is Business Intelligence a Good Career for Career Switchers?
Yes, Business Intelligence is one of the most practical and strategic career paths for professionals looking to transition from another industry.
Many career switchers mistakenly believe they need to discard their past work history and start from scratch. In reality, the most successful Business Intelligence Specialists do not enter the field as blank slates—they combine technical analytics skills with deep domain expertise.
The Domain Advantage: Pairing Experience with BI
BI is not just about writing SQL queries or building pretty charts; it is about connecting technical data structures to real-world business problems. If you already understand a specific commercial function, you possess a massive competitive advantage over traditional computer science graduates who lack business context.
Strategic domain combinations include:
- Finance + BI: Perfect for building automated financial reporting, forecasting models, and variance performance analysis.
- Marketing + BI: Ideal for optimizing customer acquisition costs (CAC), lifetime value (LTV), multi-touch attribution, and campaign ROI.
- Operations + BI: Positions you to monitor supply chain bottlenecks, labor utilization, inventory turnover, and process efficiency.
- Sales + BI: Equips you to analyze pipeline velocity, win/loss rates, quota attainment, and revenue forecasting.
- Human Resources + BI: Enables workforce analytics, retention tracking, recruitment funnel optimization, and compensation modeling.
The Winning Career-Switching Strategy
Your previous career is an asset, not baggage. The most effective strategy to break into the field is to stack technical skills on top of your existing domain knowledge:
$$\text{Existing Industry Expertise (Finance, Marketing, Ops, etc.)}$$
$$\mathbf{+}$$
$$\text{Technical BI Core (SQL, Data Modeling, Power Query, Power BI/Tableau)}$$
$$\mathbf{=}$$
$$\text{A High-Value, Domain-Specific Business Intelligence Specialist}$$
Instead of competing as a generic entry-level analyst, position yourself as a specialized professional who can walk into a department, instantly understand their operational pain points, and build the exact data systems required to solve them.
Business Intelligence Specialist Salary and Job Outlook
Salary and employment figures should always be approached with strategic caution. Compensation varies drastically depending on your country, local cost of living, specific industry, company size, seniority, and exact job title.
Furthermore, because there is no single global occupational classification for a Business Intelligence Specialist, official labor data—such as U.S. O*NET statistics tracking the broader Business Intelligence Analysts occupation—serves best as a directional benchmark rather than an absolute worldwide standard.
Key Factors That Influence Your Earning Potential
- Geographic Market & Remote Work: Salaries in major tech hubs or multinational corporations typically outpace regional averages, though remote work models continue to flatten geographic pay disparities.
- Industry Sector: Data professionals working in high-margin sectors like fintech, enterprise SaaS, healthcare, and management consulting generally command higher compensation than those in non-profit, retail, or traditional manufacturing.
- Technical Stack Complexity: Analysts who bridge the gap between basic visualization and advanced data engineering (such as managing cloud data warehouses, writing complex SQL, and building scalable semantic models) scale up the salary ladder much faster.
- Domain Expertise: Your ability to speak the language of finance, marketing, or operations directly correlates with your perceived value to executive leadership.
Smart Research Strategy
Rather than relying on static online salary calculators or outdated reports, adopt a high-signal research approach:
- Monitor Live Job Postings: Regularly review current openings in your target country and city to track real-time salary transparency laws and posted ranges.
- Verify Role Alignment: Ensure the compensation figures you review match the technical responsibilities of a true Business Intelligence Specialist (SQL, modeling, BI platforms) rather than basic spreadsheet data entry.
- Validate Close to Application: Job market conditions, hiring demand, and inflation adjustments shift rapidly, so verify current compensation trends right before you begin your active job search.
A Practical Business Intelligence Specialist Learning Roadmap
If you are starting your journey today, avoid random tutorials and fragmented tool hopping. Follow this structured, high-leverage learning sequence to build comprehensive capability and job readiness:
Phase 1 — Foundations
- Learn: Microsoft Excel, basic statistics, core data types, KPIs, business metrics, and analytical reasoning.
- Objective: Build comfort with looking at raw datasets, understanding table structures, and mapping data columns to real-world business questions.
Phase 2 — SQL (Structured Query Language)
- Learn:
SELECTstatements, filtering clauses, aggregation (GROUP BY), relationalJOINoperations, subqueries, Common Table Expressions (CTEs), and window functions (ROW_NUMBER(),LAG/LEAD). - Objective: Transition from spreadsheets to database querying, enabling you to extract, clean, and manipulate raw enterprise data independently.
Phase 3 — BI Platforms & Semantic Engineering
- Choose: Microsoft Power BI or Tableau.
- Learn: Data connections, ETL workflows (Power Query), data transformation, star-schema modeling, calculation engines (DAX or calculated fields), visualization principles, and executive dashboard design.
- Objective: Master an industry-standard visualization suite to build responsive, user-centric enterprise dashboards.
Phase 4 — Business Analysis & Problem Framing
- Practice: Turning vague stakeholder requests into sharp, measurable analytical questions.
- Example Transformation:
- Vague Request: “Sales are falling. Find out why.”
- Measurable Questions:
- When did the decline begin?
- Which product categories are affected?
- Which geographic regions are driving the shift?
- Has the active customer count changed?
- Has average order value (AOV) dropped?
- Are specific customer segments responsible for the variance?
Phase 5 — Portfolio & Project Documentation
- Build: Three to five substantial, end-to-end data projects.
- Objective: Ensure each project documents the commercial business problem, your data-cleaning process, the semantic data model, analytical queries, final visualizations, key empirical findings, and project limitations.
Phase 6 — Job Search & Market Strategy
- Execute: Search across multiple related titles—such as Business Intelligence Analyst, BI Developer, and Reporting Analyst—rather than restricting yourself exclusively to “Business Intelligence Specialist.”
- Objective: Tailor your resume, leverage your portfolio case studies, and articulate your technical and commercial reasoning with absolute confidence in interviews.
What is a Business Intelligence Specialist?
A Business Intelligence Specialist uses data, analytical techniques, BI software, and business knowledge to produce reports, dashboards, analysis, and insights that support organizational decisions.
What skills do I need to become a Business Intelligence Specialist?
Core skills commonly include SQL, data preparation, data modeling, data visualization, BI platforms such as Power BI or Tableau, business analysis, communication, and spreadsheet skills.
Is SQL necessary for Business Intelligence?
SQL is not universally mandatory for every BI position, but it is a highly valuable skill. Official U.S. employer-posting data lists SQL in 35% of job postings associated with the Business Intelligence Analysts occupation.
Should I learn Power BI or Tableau?
Start with one rather than trying to master both simultaneously. Power BI and Tableau are both established BI platforms, and both appear in current occupational software-skill data for BI analysts. The better first choice depends on the employers, industries, and job market you are targeting.
Can I become a Business Intelligence Specialist without a data degree?
Yes, depending on the employer and role. Degree requirements vary, and occupational standards note that while many roles in the field require a bachelor’s degree, practical skills, relevant experience, domain knowledge, and demonstrable portfolio projects can open doors for self-taught professionals.
Do I need Python to work in business intelligence?
Not necessarily. Python can be valuable for advanced data manipulation, automation, and machine learning integration, but it is not the first skill you need to build a BI foundation. SQL, data preparation, modeling, visualization, and business understanding are far more directly aligned with core responsibilities.
Is Business Intelligence the same as data analytics?
They overlap heavily but are not identical concepts. Business intelligence generally focuses on descriptive analytics—using historical organizational data for reporting, performance monitoring, dashboards, and decision support. Data analytics is a broader term that can also include diagnostic, predictive, statistical, and product-level analysis.
What should I put in a BI portfolio?
Include three to five end-to-end projects that demonstrate your ability to solve business problems with data. A strong project case study should outline the original commercial question, data preparation, SQL analysis, data modeling, dashboard interface, key findings, and project limitations.
In Conclusion
A Business Intelligence Specialist sits at the critical intersection of data, technology, and commercial decision-making.
The most valuable skills to build on your journey include:
- SQL for querying relational data independently.
- Data Preparation for cleaning, shaping, and ensuring data quality.
- Data Modeling for structuring information correctly via star schemas and relationships.
- Power BI, Tableau, or another BI platform for analysis and reporting.
- Data Visualization for designing intuitive dashboards and communicating findings.
- Business Knowledge for understanding the operational context behind the numbers.
- Executive Communication for turning complex analysis into clear, actionable insights.
You do not need to master every data technology on the market before applying for BI-related roles. Build a focused technical foundation, create realistic projects, document your reasoning, and learn to explain how your analysis directly addresses a real business problem.
Your Immediate Next Step
Choose one dataset and one specific business question, then build a small end-to-end project using SQL and a BI platform. That single action will move you from passively learning about business intelligence to actually practicing it.